Table of Contents
1 make the plot with specified lines and labels
Simple contour plot with lines
This produces a simple oldschool contour plot with labels
[1]:
import matplotlib.pyplot as plt
import numpy as np

import context
setting context.data_dir to /Users/phil/repos/eosc213_students/notebooks/cookbook_examples
[2]:
data = np.load(context.data_dir / "contourline.npz")
x1, y1, psi = data["x1"], data["y1"], data["psi"]
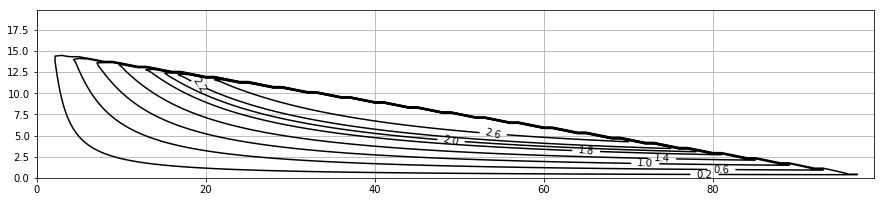
make the plot with specified lines and labels
They don’t have to be the same – you can label only some of the lines. You can control line thickness, dashed/solid/dotted etc., see the matplotlib docs.
[3]:
fig, ax = plt.subplots(1, 1, figsize=(15, 10))
the_levels = [0.2, 0.6, 1.0, 1.4, 1.8, 2.0, 2.2, 2.6]
cs = ax.contour(x1, y1, psi, levels=the_levels, colors="k")
ax.set_aspect(1)
ax.clabel(cs, the_levels, fmt="%3.1f")
ax.grid(True)