7.5. Multi Line Plots
Multi-line plots are created using Matplotlib’s pyplot library. This section builds upon the work in the previous section where a plot with one line was created. This section also introduces Matplotlib’s object-oriented approach to building plots. The object-oriented approach to building plots is used in the rest of this chapter.
7.5.1. The Matplotlib’s object-oriented interface
An object-oriented plotting interface is an interface where components of the plot (like the axis, title, lines, markers, tick labels, etc.) are treated as programmatic objects that have attributes and methods associated with them.
To create a new object is called instantiation. Once an object is created, or instantiated, the properties of that object can be modified, and methods can be called on that object.
The basic anatomy of a Matplotlib plot includes a couple of layers, each of these layers is a Python object:
Figure object: The bottom layer. Think of the figure object as the figure window which contains the minimize, maximize, and close buttons. A figure window can include one plot or multiple plots.
Plot objects: A plot builds on the figure layer. If there are multiple plots, each plot is called a subplot.
Axis objects: An axis is added to a plot layer. Axis can be thought of as sets of x and y axis that lines and bars are drawn on. An Axis contains daughter attributes like axis labels, tick labels, and line thickness.
Data objects: data points, lines, shapes are plotted on an axis.
Matplotlib’s plt.subplot() function is used to build figure objects. The plt.subplot() function creates both a figure object and axis objects. We say the plt.subplot() function instantiates a figure object and instantiates an axis object. For now, we’ll leave the subplot() arguments blank. By default, the subplot() function creates a single figure object and a single axis object. By convention we’ll call the figure object fig and the axis object ax. Note these two outputs of the plt.subplots() function are separated by a comma.
fig, ax = plt.subplots()
We instantiated a figure object and axis object, now both of these objects need attributes. We add attributes to the axis object to build a plot. NumPy arrays or Python lists x, y, and z can be added to axis object ax.
ax.plot(x,y)
ax.plot(x,z)
We add a plot attribute (a line) to our axis object ax using the object-oriented structure <object>.<attribute>. In this case, ax is the object and plot is the attribute.
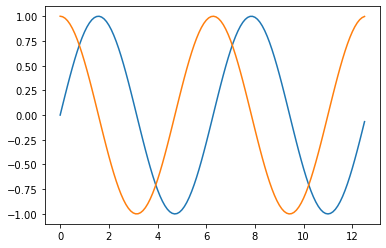
The next code section demonstrates how to build a multi-line plot with Matplotlib’s object-oriented interface.
import numpy as np
import matplotlib.pyplot as plt
# if using a Jupyter notebook, inlcude:
%matplotlib inline

x = np.arange(0,4*np.pi,0.1)
y = np.sin(x)
z = np.cos(x)

fig, ax = plt.subplots()

ax.plot(x,y)
ax.plot(x,z)

plt.show()
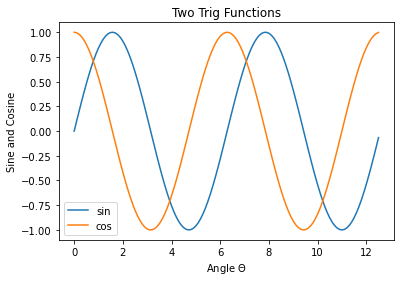
The ax object has many methods and attributes. In Python a method is sort of like a function, but methods typically modify the object they are associated with, while functions modify their input arguments.
Two methods we can run on the ax object include ax.set_title() and ax.legend(). A couple daughter objects include ax.xaxis and ax.yaxis. These daughter objects in turn have methods such as ax.xaxis.set_label_text() and ax.yaxis.set_label_text().
The code section below demonstrates using objects, attributes, and methods to build a multi-line plot.
import numpy as np
import matplotlib.pyplot as plt
# if using a Jupyter notebook, include:
%matplotlib inline

x = np.arange(0,4*np.pi,0.1)
y = np.sin(x)
z = np.cos(x)

fig, ax = plt.subplots()

ax.plot(x,y)
ax.plot(x,z)

ax.set_title('Two Trig Functions')
ax.legend(['sin','cos'])
ax.xaxis.set_label_text('Angle $\Theta$')
ax.yaxis.set_label_text('Sine and Cosine')

plt.show()
The table below shows common commands to build plots using Matplotlib’s object-oriented interface.
Object-oriented command |
Description |
Corresponding |
|---|---|---|
|
create a figure and axis object |
- |
|
create a line plot |
|
|
plot title |
|
|
x-axis label |
|
|
y-axis label |
|
|
legend |
|
|
x-axis limits |
|
|
y-axis limits |
|
|
both axis limits |
- |
|
grid in both directions |
|
|
vertical grid lines |
- |
|
horizontal grid lines |
- |
|
x-axis tick locations |
|
|
x-axis tick labels |
|
|
y-axis tick locations |
|
|
y-axis tick labels |
|
|
remove x tick labels |
|
|
remove y tick labels |
|
|
equal axis scales |
- |
|
adjust padding |
|
|
show the plot |
|