7.13. Plot Styles
Colors, font sizes, line thickness, and many other plot attributes all have default values in Matplotlib. In addition to the default style for these plot attributes, additional styles are available.
To use the default style, either don’t specify a style or use the line plt.style.use('default'). If you want to apply a different style to a plot use the line:
plt.style.use('style')
The 'style' is supplied to the method as a string, surrounded by quotes.
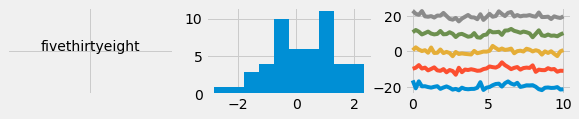
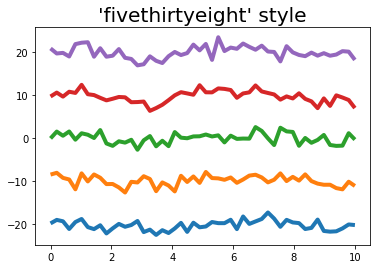
The code below builds a plot with 'fivethirtyeight' style, a style similar to the plots on fivethirtyeight.com.
import numpy as np
import matplotlib.pyplot as plt
# if using a Jupyter notebook, include:
%matplotlib inline

x = np.linspace(0, 10)
fig, ax = plt.subplots()

plt.style.use('fivethirtyeight')

for n in range(-20,30,10):
    ax.plot(x, np.cos(x) + np.random.randn(50) + n)

ax.set_title("'fivethirtyeight' style")

plt.show()
There are many different styles available. You can list the available Matplotlib styles with the command:
for style in plt.style.available:
    print(style)
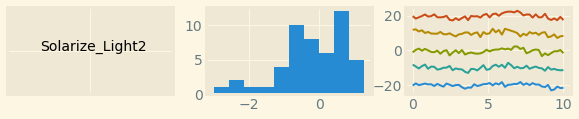
Solarize_Light2
_classic_test_patch
bmh
classic
dark_background
fast
fivethirtyeight
ggplot
grayscale
seaborn
seaborn-bright
seaborn-colorblind
seaborn-dark
seaborn-dark-palette
seaborn-darkgrid
seaborn-deep
seaborn-muted
seaborn-notebook
seaborn-paper
seaborn-pastel
seaborn-poster
seaborn-talk
seaborn-ticks
seaborn-white
seaborn-whitegrid
tableau-colorblind10
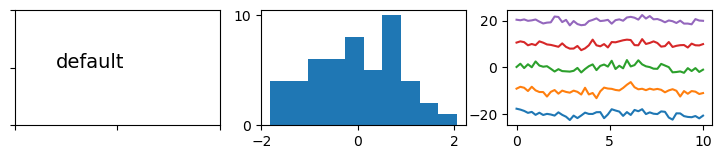
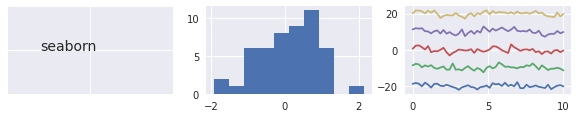
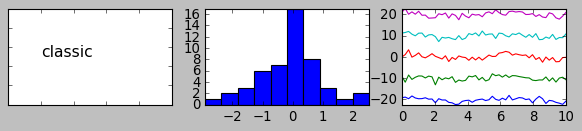
The code section below displays a couple of Matplotlib’s available plot styles including 'default', 'seaborn' and Matplotlib’s older 'classic' style.
def pl(ax,st):
    x = np.linspace(0, 10)
    for n in range(-20,30,10):
        ax.plot(x, np.cos(x) + np.random.randn(50) + n)

def his(ax):
    x = np.random.randn(50)
    ax.hist(x)

def lb(ax,s):
    ax.text(0.2,0.5,s, fontsize=14)
    ax.xaxis.set_ticklabels([])
    ax.yaxis.set_ticklabels([])

def make_fig(st):
    with plt.style.context(st):
        fig,[ax1,ax2,ax3] = plt.subplots(1,3,figsize=(9,1.5))
        lb(ax1,st)
        his(ax2)
        pl(ax3,st)

s = ['default','fivethirtyeight','seaborn', 'Solarize_Light2','classic']

for st in s:
    make_fig(st)

plt.show()