7.11. Plot annotations
Sometimes it is useful for problem solvers to annotate plots. Text can be included on a plot to indicate a point of interest or highlight a specific feature of a plot.
The code section below builds a simple line plot and applies three annotations (three arrows with text) on the plot. Matplotlib’s ax.annotate() method creates the annotations. Multiple keyword arguments can be passed to ax.annotate() method to specify the annotation location and style the annotation.
ax.annotate('text', xy= , xycoodrs= , xytext= , arrowprops= )
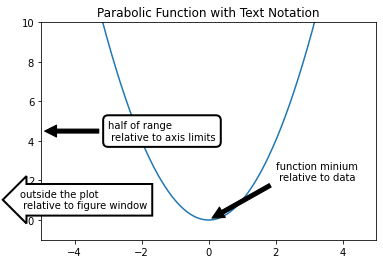
The keyword argument to pay attention to in the next code section is xycoords= . Each of the three annotations in the next figure has a different xycoords= keyword argument. The annotation can be located relative to the plot data, located relative to the axis, or located relative to the figure window.
In the first annotation, xycoords='data'. This means the annotation is placed relative to the data. Since xy=(0, 0), the annotation arrow points to the data point 0,0 .
In the second annotation, xycoords='axes fraction'. This means the second annotation is placed relative to the axis. Since xy=(0, 0.5), the annotation arrow points all the way to the left edge of the x-axis and half way up the y-axis.
In the third annotation, xycoords='figure pixels'. This means the third annotation is placed relative to the figure window. Since xy=(20, 75), the third annotation arrow points 20 pixels to the right and 75 pixels up from the bottom left corner of the figure window.
The chart below summarizes Matplotlib’s ax.annotate() keyword arguments.
|
description |
|---|---|
|
annotation location |
|
annotation location relative to data |
|
annotation location relative to axis |
|
annotation location relative to figure window |
|
define bounding box properties with a dictionary |
|
define arrow properties with a dictionary |
|
horizontal alignment of annotation |
|
vertical alignment of annotation |
The next code section builds a figure with three annotation arrows.
import numpy as np
import matplotlib.pyplot as plt
# if using a Jupyter notebook, include:
%matplotlib inline

x = np.arange(-5, 5, 0.01)
y = x**2

fig, ax = plt.subplots()

# Plot a line
ax.plot(x, y)

# first annotation relative to the data
ax.annotate('function minium \n relative to data',
            xy=(0, 0),
            xycoords='data',
            xytext=(2, 3),
            arrowprops=
                dict(facecolor='black', shrink=0.05),
                horizontalalignment='left',
                verticalalignment='top')

# second annotation relative to the axis limits
bbox_props = dict(boxstyle="round,pad=0.5", fc="w", ec="k", lw=2)

ax.annotate('half of range \n relative to axis limits',
            xy=(0, 0.5),
            xycoords='axes fraction',
            xytext=(0.2, 0.5),
            bbox=bbox_props,
            arrowprops=
                dict(facecolor='black', shrink=0.05),
                horizontalalignment='left',
                verticalalignment='center')

# third annotation relative to the figure window
bbox_props = dict(boxstyle="larrow,pad=0.5", fc="w", ec="k", lw=2)

ax.annotate('outside the plot \n relative to figure window',
            xy=(20, 75),
            xycoords='figure pixels',
            horizontalalignment='left',
            verticalalignment='top',
            bbox=bbox_props)

ax.set_xlim(-5,5)
ax.set_ylim(-1,10)
ax.set_title('Parabolic Function with Text Notation')

plt.show()