7.12. Subplots
Sometimes it is useful for problem solvers to include a couple plots in the same figure window. This can be accomplished using Matplotlib subplots. Matplotlib’s plt.subplot() function can include two positional arguments for the number of rows of subplots in the figure and the number of columns of subplots in the figure. The general format is:
fig, <ax objects> = plt.subplots(rows, cols)
Where rows and cols are integers that control the subplot layout. The <ax objects> needs to have dimensions that correspond to rows and cols.
If a 2 row by 2 column array of plots is created, the <ax object> must to be arrayed as shown below:
fig, ( (ax1,ax2), (ax3,ax4) ) = plt.subplots(2,2)
If a 2 row by 3 column array of plots is created, the <ax objects> must be arrayed to correspond to these dimensions:
fig, ( (ax1,ax2,a3), (ax4,ax5,ax6) ) = plt.subplots(2, 3)
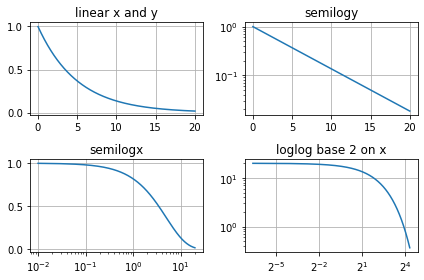
Subplots are useful if you want to show the same data on different scales. The plot of an exponential function looks different on a linear scale compared to a logarithmic scale. Matplotlib contains three plotting methods which scale the x and y-axis linearly or logarithmically. The table below summarizes Matplotlib’s axis scaling methods.
Matplotlib method |
axis scaling |
|---|---|
|
linear x, linear y |
|
linear x, logarithmic y |
|
logarithmic x, linear y |
|
logarithmic x, logarithmic y |
The code section below builds a 2 row by 2 column array of subplots in one figure. The axes of each subplot is scaled in a different way.
import matplotlib.pyplot as plt
import numpy as np
# if using a Jupyter notebook, include:
%matplotlib inline

# Data for plotting
t = np.arange(0.01, 20.0, 0.01)

# Create a figure with 2 rows and 2 cols of subplots
fig, ((ax1, ax2), (ax3, ax4)) = plt.subplots(2, 2)

# linear x and y axis
ax1.plot(t, np.exp(-t / 5.0))
ax1.set_title('linear x and y')
ax1.grid()

# log y axis
ax2.semilogy(t, np.exp(-t / 5.0))
ax2.set_title('semilogy')
ax2.grid()

# log x axis
ax3.semilogx(t, np.exp(-t / 5.0))
ax3.set_title('semilogx')
ax3.grid()

# log x and y axis
ax4.loglog(t, 20 * np.exp(-t / 5.0), basex=2)
ax4.set_title('loglog base 2 on x')
ax4.grid()

fig.tight_layout()
plt.show()
/tmp/ipykernel_945336/105303017.py:28: MatplotlibDeprecationWarning: The 'basex' parameter of __init__() has been renamed 'base' since Matplotlib 3.3; support for the old name will be dropped two minor releases later.
  ax4.loglog(t, 20 * np.exp(-t / 5.0), basex=2)
