57. phase shift examples#
Here is what the sine and cosine waves look like for different phase shifts. Note that positive phase shifts move the peaks to the left. For radar, that means that a positive phase change is associated with motion twoards the radar.
import numpy as np
from numpy import pi
import matplotlib.pyplot as plt
thetime=np.arange(0.,2*pi,0.05)
thewave=thetime/(2.*pi)
thirty=30.*pi/180.
sixty=2.*thirty
ninety=3.*thirty
onetwenty=2.*sixty
oneeighty=3.*sixty
fig1,axis1=plt.subplots(1,1)
axis1.plot(thewave,np.cos(thetime),'b-',label='0')
axis1.plot(thewave,np.cos(thetime + thirty),'c-',label='30')
axis1.plot(thewave,np.cos(thetime + sixty),'g-',label='60')
axis1.plot(thewave,np.cos(thetime + ninety),'k-',label='90')
axis1.plot(thewave,np.cos(thetime + onetwenty),'m-',label='120')
axis1.plot(thewave,np.cos(thetime + oneeighty),'r-',label='180')
axis1.set_xlabel('horizontal position (in wavelengths)')
axis1.set_ylabel('amplitude')
axis1.set_title('cosine waves for 5 phase shifts')
axis1.legend(loc='best')
axis1.grid(True)
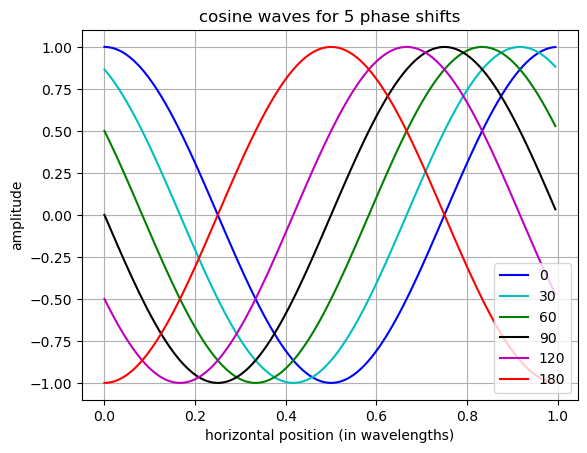
fig2,axis2=plt.subplots(1,1)
axis2.plot(thewave,np.sin(thetime),'b-',label='0')
axis2.plot(thewave,np.sin(thetime + thirty),'c-',label='30')
axis2.plot(thewave,np.sin(thetime + sixty),'g-',label='60')
axis2.plot(thewave,np.sin(thetime + ninety),'k-',label='90')
axis2.plot(thewave,np.sin(thetime + onetwenty),'m-',label='120')
axis2.plot(thewave,np.sin(thetime + oneeighty),'r-',label='180')
axis2.set_xlabel('horizontal position (in wavelengths)')
axis2.set_ylabel('amplitude')
axis2.set_title('sine waves for 5 phase shifts')
axis2.legend(loc='best')
axis2.grid(True)
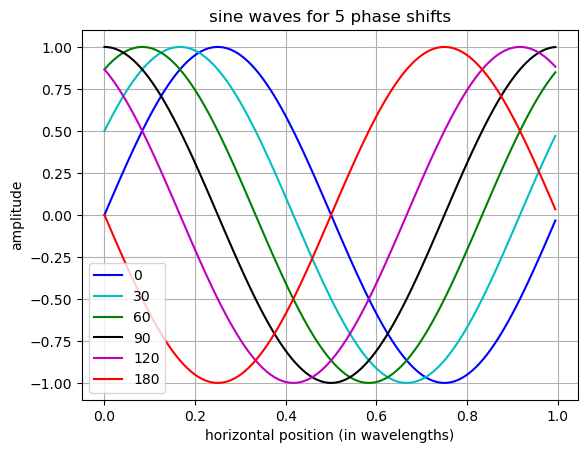
fig3,axis3=plt.subplots(1,1)
line1=axis3.plot(thewave,np.cos(thetime),'b-')
newX=thetime
#zero out the inital wave so it looks like a reflection
newX[newX > 0.75*2.*pi]=np.nan
#
# add a pi phase shift
#
newX = newX + pi
line2=axis3.plot(thewave,np.cos(newX),'r-')
axis3.set_xlabel('horizontal position (in wavelengths)')
axis3.set_ylabel('amplitude at receiver')
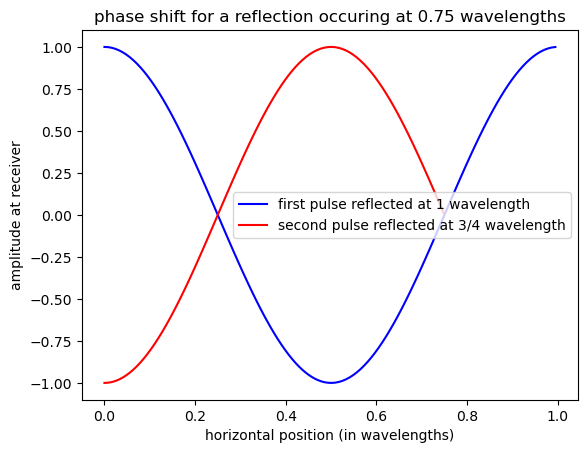
axis3.set_title('phase shift for a reflection occuring at 0.75 wavelengths')
axis3.legend((line1[0],line2[0]),('first pulse reflected at 1 wavelength',
'second pulse reflected at 3/4 wavelength'));
plt.show()