65. goes-earthcare overlay#
65.1. Introduction#
This notebook
reads in the netcdf file container the Earthcare case you saved in goes-earthcare overlay
finds the closest GOES 16 or GOES 18 image and extracts the cloud top height and the channel 14 (11 micron) brightness temperature
crops the GOES image to the region of the Earthcare radar groundtrack
plots the groundtrack on top of the GOES heights
This sets up the second problem in Assignment 8
65.2. Installation#
fetch and rebase to pick up the week12 folder with this ipynb file
pip install -r requirements.txtto install the newest version of thea301_extraslibrary
65.3. open the earthcare radar file#
from pathlib import Path
import xarray as xr
import numpy as np
import pyproj
from matplotlib import pyplot as plt
import datetime
import pytz
import pandas as pd
from pyproj import CRS, Transformer
import affine
from a301_extras.sat_lib import make_new_rioxarray
import cartopy.crs as ccrs
import cartopy.feature as cfeature
running __init__.py
/Users/phil/mini310/envs/a301/lib/python3.13/site-packages/goes2go/data.py:673: FutureWarning: 'H' is deprecated and will be removed in a future version. Please use 'h' instead of 'H'.
  within=pd.to_timedelta(config["nearesttime"].get("within", "1h")),
/Users/phil/mini310/envs/a301/lib/python3.13/site-packages/goes2go/NEW.py:185: FutureWarning: 'H' is deprecated and will be removed in a future version. Please use 'h' instead of 'H'.
  within=pd.to_timedelta(config["nearesttime"].get("within", "1h")),
data_dir = Path().home() / 'repos/a301/satdata/earthcare'
radar_filepath = list(data_dir.glob("**/*.nc"))[0]
radar_ds = xr.open_dataset(radar_filepath)
radar_ds
<xarray.Dataset> Size: 21MB
Dimensions:     (height: 218, distance: 8021)
Coordinates:
  * height      (height) float64 2kB 2.019e+04 2.009e+04 ... -1.494e+03
  * distance    (distance) float64 64kB 0.0 0.5027 1.006 ... 4.172e+03 4.172e+03
Data variables:
    dbZ         (height, distance) float32 7MB ...
    velocity    (height, distance) float32 7MB ...
    binHeights  (height, distance) float32 7MB ...
    longitude   (distance) float64 64kB ...
    latitude    (distance) float64 64kB ...
    time        (distance) datetime64[ns] 64kB ...
Attributes:
    history:   written by ec_to_xarray on 2025-03-29 09:50:41.584666
    timezone:  UTC
casenum: case465.3.1. get the time and bounding box corners#
midpoint = int(len(radar_ds['time'])/2.)
midtime = radar_ds['time'][midpoint].data

#datetime.datetime(midtime)
timestamp = pd.to_datetime(midtime)
timestamp
Timestamp('2024-12-13 22:50:35.447906')
lats = radar_ds['latitude']
lons = radar_ds['longitude']
ymin, ymax = np.min(lats.data),np.max(lats.data)
xmin, xmax = np.min(lons.data),np.max(lons.data)
print(f"{(xmin,ymin,xmax,ymax)=}")
(xmin,ymin,xmax,ymax)=(np.float64(-131.09466120436687), np.float64(22.36695226805222), np.float64(-119.84172089591294), np.float64(59.05850560602393))
65.3.2. overwrite bounding box#
We want a wider bounding box, since radar groundtrack is almost due north-south. GOES west probably has a better view, so use GOES 18
xmin = -145
xmax = -85.
ymax = 55
65.4. Find the nearest GOES image#
65.4.1. Function get_goes#
from goes2go import goes_nearesttime
save_dir = Path.home() / "repos/a301/satdata/earthcare"
from a301_extras.sat_lib import get_goes
65.5. Get the cloudtop height#
This variable is in the ABI-L2-ACHAC product, at 10 km resolution. It is available every 60 minutes. The
full description is here
download_dict = dict(satellite="goes18",product = "ABI-L2-ACHAC",save_dir=save_dir)
writeit = False
if writeit:
    the_path = get_goes(timestamp,**download_dict)
else:
    the_path = ('noaa-goes18/ABI-L2-ACHAC/2024/348/22/OR_ABI-L2-ACHAC-M6_G18_s20243482251177'
                '_e20243482253550_c20243482256172.nc'
               )
full_path = save_dir / the_path
the_path
'noaa-goes18/ABI-L2-ACHAC/2024/348/22/OR_ABI-L2-ACHAC-M6_G18_s20243482251177_e20243482253550_c20243482256172.nc'
goes_ct = xr.open_dataset(full_path,mode = 'r',mask_and_scale = True)
type(goes_ct)
xarray.core.dataset.Dataset
65.6. calculate the projection coordinates#
The x and y coordinates for the Dataset goes_ct are in radians. The function parse_cf (where CF stands
for climate and forecast) extracts a dataset variable as a DataArray and converts those x and y values to meters in the geostationary CRS by multiplying by the height of the satellite. It also sets the grid_mapping attribute
to goes_imager_projection which allows goes2go to produce the geostationary CRS using cloud_ct.metpy.pyproj_crs or cloud_ct.metpy.cartopy_crs. The CF conventions
are documented here ).
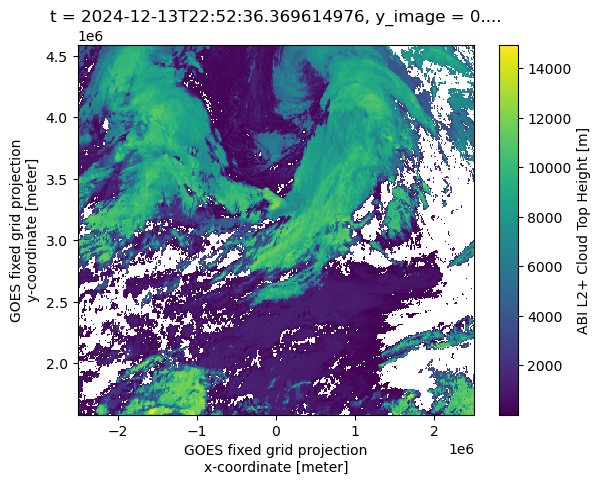
cloud_top = goes_ct.metpy.parse_cf('HT')
type(cloud_top)
xarray.core.dataarray.DataArray
cloud_top.plot.imshow()
<matplotlib.image.AxesImage at 0x13899f4d0>
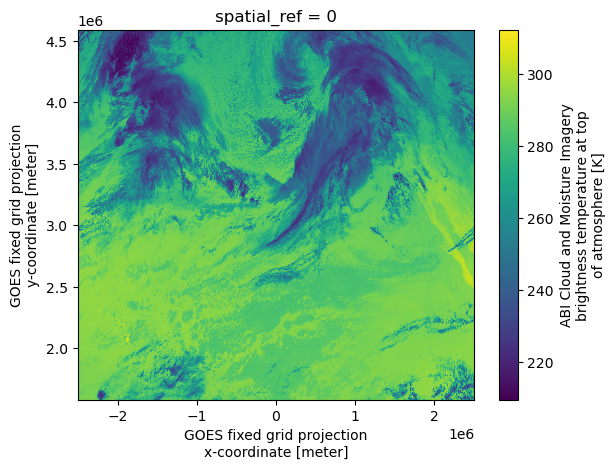
65.7. Get the 11 micron thermal band#
This is channel 14 in the moisture and cloud product. The brightness temperatures will have 2 km resolution, but no atmospheric correction
download_dict = dict(satellite="goes18",
                     product = "ABI-L2-MCMIPC",save_dir=save_dir)
writeit = False
if writeit:
    the_path = get_goes(timestamp,**download_dict)
else:
    the_path = ('noaa-goes18/ABI-L2-MCMIPC/2024/348/22/OR_ABI-L2-MCMIPC-M6_G18_s20243482251177'
                '_e20243482253562_c20243482254081.nc'
               )
full_path = save_dir / the_path
the_path
'noaa-goes18/ABI-L2-MCMIPC/2024/348/22/OR_ABI-L2-MCMIPC-M6_G18_s20243482251177_e20243482253562_c20243482254081.nc'
goes_mc = xr.open_dataset(full_path,mode = 'r',mask_and_scale = True)
chan_14 = goes_mc.metpy.parse_cf('CMI_C14')
65.8. Calculate the affine transforms#
65.8.1. Function get_affine#
def get_affine(goes_da):
    resolutionx = np.mean(np.diff(goes_da.x))
    resolutiony = np.mean(np.diff(goes_da.y))
    ul_x = goes_da.x[0].data
    ul_y = goes_da.y[0].data
    goes_transform = affine.Affine(resolutionx, 0.0, ul_x, 0.0, resolutiony, ul_y)
    return goes_transform
cloud_top_affine = get_affine(cloud_top)
chan_14_affine = get_affine(chan_14)
chan_14_affine, cloud_top_affine
(Affine(np.float64(2004.017317102528), 0.0, np.float64(-2504019.637719609),
        0.0, np.float64(-2004.017295251391), np.float64(4588197.756226748)),
 Affine(np.float64(10020.086997746615), 0.0, np.float64(-2500011.439311132),
        0.0, np.float64(-10020.086272212475), np.float64(4584189.291191623)))
65.9. convert cloud_top to a rioxarray#
Use make_new_rioxarray introduced in Combining goes and landsat data using rioxarray
def make_new_rioxarray(
    rawdata: np.ndarray,
    coords: dict,
    dims: tuple,
    crs: pyproj.CRS,
    transform: affine.Affine,
    attrs: dict | None = None,
    missing: float | None = None,
    name: str | None = "name_here") -> xr.DataArray:
    """
    create a new rioxarray from an ndarray plus components

    Parameters
    ----------

    rawdata: numpy array
    crs: pyproj crs for scene
    coords: xarray coordinate dict
    dims: x and y dimension names from coords
    transform: scene affine transform
    attrs: optional attribute dictionary
    missing: optional missing value
    name: optional variable name, defaults to "name_here"

    Returns
    -------

    rio_da: a new rioxarray
    """
65.9.1. Set cloud top height attributes#
attribute_names=['long_name','standard_name','units','grid_mapping']
attributes ={name:item for name,item in cloud_top.attrs.items()
             if name in attribute_names}
attributes['history'] = f"written by goes_earthcare.ipynb on {datetime.datetime.now()}"
attributes['start'] = goes_ct.attrs['time_coverage_start']
attributes['end'] = goes_ct.attrs['time_coverage_end']
attributes['dataset'] = goes_ct.attrs['dataset_name']
attributes['title'] = 'cloud layer height'
attributes
{'long_name': 'ABI L2+ Cloud Top Height',
 'standard_name': 'geopotential_height_at_cloud_top',
 'units': 'm',
 'grid_mapping': 'goes_imager_projection',
 'history': 'written by goes_earthcare.ipynb on 2025-04-18 11:28:11.800296',
 'start': '2024-12-13T22:51:17.7Z',
 'end': '2024-12-13T22:53:55.0Z',
 'dataset': 'OR_ABI-L2-ACHAC-M6_G18_s20243482251177_e20243482253550_c20243482256172.nc',
 'title': 'cloud layer height'}
the_dims = ('y','x')
goes_crs = cloud_top.metpy.pyproj_crs
coords_cloud_top = dict(x=cloud_top.x,y=cloud_top.y)
cloud_top_da = make_new_rioxarray(cloud_top,
                                  coords_cloud_top,
                                  the_dims,
                                  goes_crs,
                                  cloud_top_affine,
                                  attrs = attributes,
                                  missing=np.float32(np.nan),
                                  name = 'ht')
attribute_names=['long_name','standard_name','units','grid_mapping']
attributes ={name:item for name,item in chan_14.attrs.items()
             if name in attribute_names}
attributes['history'] = f"written by goes_earthcare.ipynb on {datetime.datetime.now()}"
attributes['start'] = goes_mc.attrs['time_coverage_start']
attributes['end'] = goes_mc.attrs['time_coverage_end']
attributes['dataset'] = goes_mc.attrs['dataset_name']
attributes['title'] = 'chan_14'
attributes
{'long_name': 'ABI Cloud and Moisture Imagery brightness temperature at top of atmosphere',
 'standard_name': 'toa_brightness_temperature',
 'units': 'K',
 'grid_mapping': 'goes_imager_projection',
 'history': 'written by goes_earthcare.ipynb on 2025-04-18 11:28:12.003302',
 'start': '2024-12-13T22:51:17.7Z',
 'end': '2024-12-13T22:53:56.2Z',
 'dataset': 'OR_ABI-L2-MCMIPC-M6_G18_s20243482251177_e20243482253562_c20243482254081.nc',
 'title': 'chan_14'}
65.10. convert chan_14 to a rioxarray#
65.10.1. set chan_14 attributes#
the_dims = ('y','x')
goes_crs = cloud_top.metpy.pyproj_crs
coords_chan_14 = dict(x=chan_14.x,y=chan_14.y)
chan_14_da = make_new_rioxarray(chan_14,
                                  coords_chan_14,
                                  the_dims,
                                  goes_crs,
                                  chan_14_affine,
                                  attrs = attributes,
                                  missing=np.float32(np.nan),
                                  name = 'chan_14')
chan_14_da.plot.imshow()
<matplotlib.image.AxesImage at 0x139905310>
65.11. crop the images#
We want to crop the images to the radar track. To do that, we first need to get
the bounding box in geostationary coordinates, so we can use the rio.clip_box function.
We did this in week 8 in Now clip the GOES image to Landsat bounds
xmin,ymin,xmax,ymax
(-145, np.float64(22.36695226805222), -85.0, 55)
65.11.1. Transform the bounds from lat/lon to geostationary crs#
#
# transform bounds from lat,lon to goes crs
#
latlon_crs = pyproj.CRS.from_epsg(4326)
transform = Transformer.from_crs(latlon_crs, goes_crs,always_xy=True)
xmin_goes,ymin_goes = transform.transform(xmin,ymin)
xmax_goes,ymax_goes = transform.transform(xmax,ymax)
print(f"{(xmax_goes - xmin_goes)=} m")
print(f"{(ymax_goes - ymin_goes)=} m")
bounds_goes = xmin_goes,ymin_goes,xmax_goes,ymax_goes
(xmax_goes - xmin_goes)=3372114.2185337567 m
(ymax_goes - ymin_goes)=2265081.2815486565 m
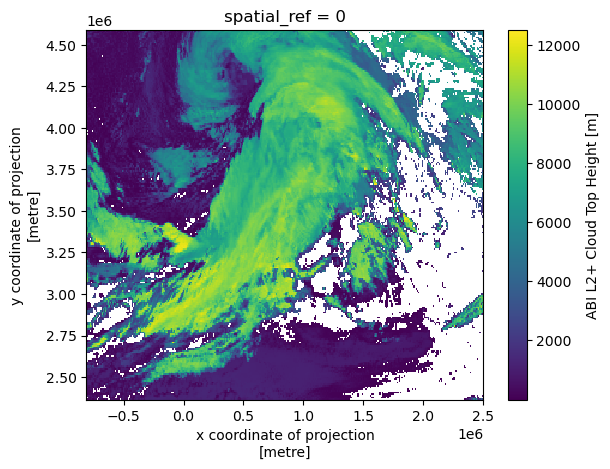
65.11.2. Crop using clip_box#
#
# now crop to these bounds using clip_box
#
clipped_cloud_top=cloud_top_da.rio.clip_box(*bounds_goes)
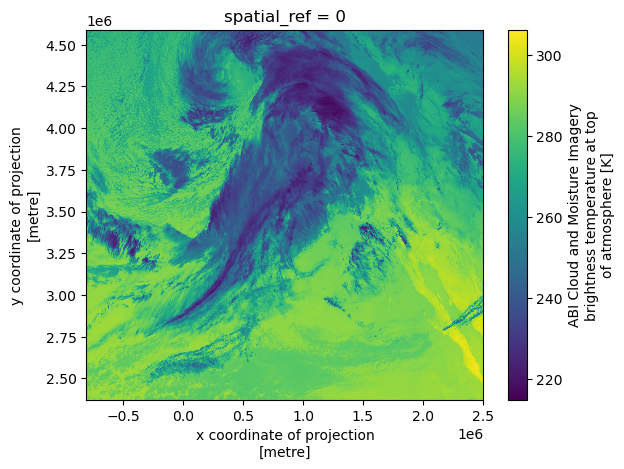
clipped_chan_14 = chan_14_da.rio.clip_box(*bounds_goes)
clipped_cloud_top.plot.imshow()
<matplotlib.image.AxesImage at 0x139a39590>
clipped_chan_14.plot.imshow()
<matplotlib.image.AxesImage at 0x139aefed0>
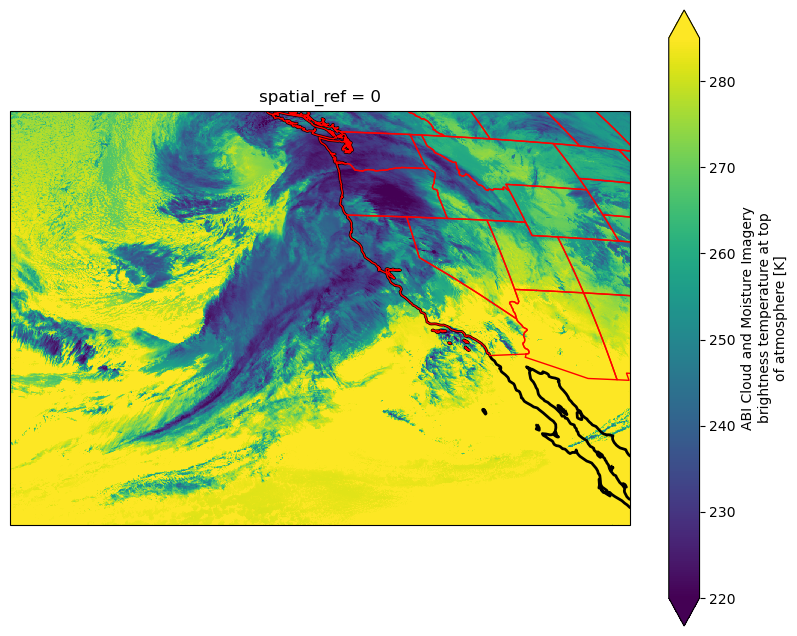
65.12. Make cartopy plots with radar ground track#
Borrow code from Plot the mapped image using cartopy
extent = (xmin_goes,xmax_goes,ymin_goes,ymax_goes*1.3)
cartopy_crs = cloud_top.metpy.cartopy_crs
fig,ax = plt.subplots(1,1,figsize=(10,8), subplot_kw={"projection":cartopy_crs})
clipped_chan_14.plot.imshow(
    ax = ax,
    origin="upper",
    extent= extent,
    transform=cartopy_crs,
    interpolation="nearest",
    vmin=220,
    vmax=285
);
ax.coastlines(resolution="50m", color="black", linewidth=2)
ax.add_feature(ccrs.cartopy.feature.STATES,edgecolor="red")
<cartopy.mpl.feature_artist.FeatureArtist at 0x139c41f90>
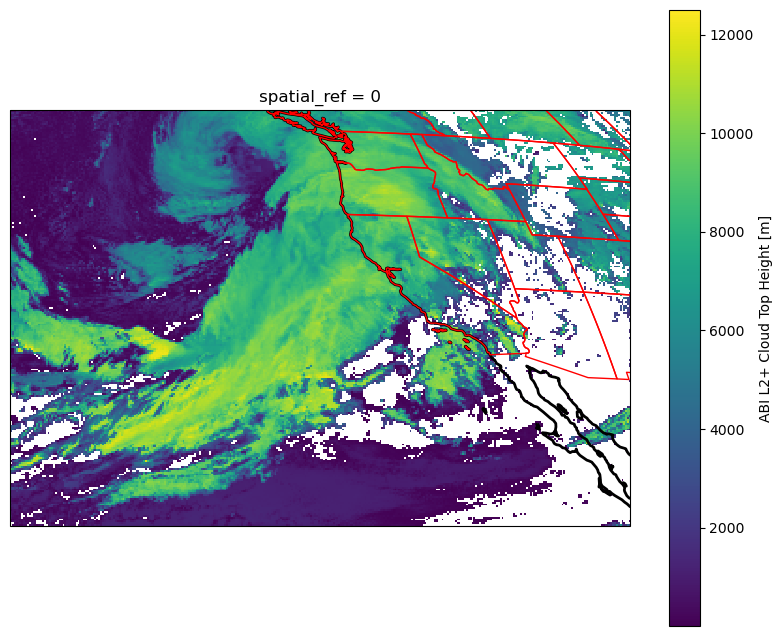
extent = (xmin_goes,xmax_goes,ymin_goes,ymax_goes*1.8)
fig,ax = plt.subplots(1,1,figsize=(10,8), subplot_kw={"projection":cartopy_crs})
clipped_cloud_top.plot.imshow(
    ax = ax,
    origin="upper",
    extent= extent,
    transform=cartopy_crs,
    interpolation="nearest"
);
ax.coastlines(resolution="50m", color="black", linewidth=2)
ax.add_feature(ccrs.cartopy.feature.STATES,edgecolor="red");
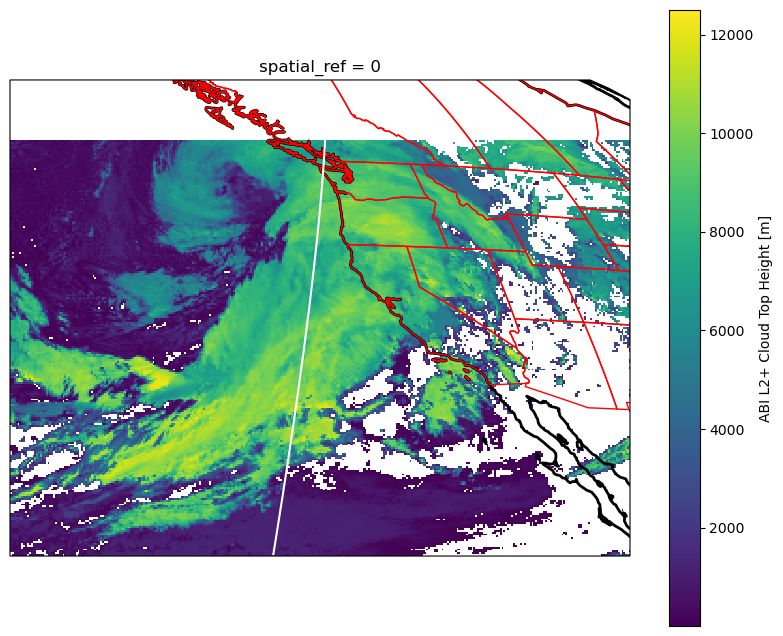
65.13. Add the groundtrack#
goes_x, goes_y =  transform.transform(lons, lats)
hit = lats < 55
ax.plot(goes_x[hit],goes_y[hit],'w-')
display(fig)
65.14. write the file out to tiff#
Add the cartopy crs as an attribute so that we can make a map with the image. There’s a cartopy bug that prevents us from using the DataArray.rio.crs pyproj version, but we’ll need that one to translate lat/lon into goex x,y in Assignment 8
cartopy_crs_string = cartopy_crs.to_wkt()
cartopy_crs_string
'PROJCRS["unknown",BASEGEOGCRS["unknown",DATUM["Unknown based on GRS 1980 ellipsoid",ELLIPSOID["GRS 1980",6378137,298.2572221,LENGTHUNIT["metre",1,ID["EPSG",9001]]]],PRIMEM["Greenwich",0,ANGLEUNIT["degree",0.0174532925199433],ID["EPSG",8901]]],CONVERSION["unknown",METHOD["Geostationary Satellite (Sweep X)"],PARAMETER["Longitude of natural origin",-137,ANGLEUNIT["degree",0.0174532925199433],ID["EPSG",8802]],PARAMETER["Satellite Height",35786023,LENGTHUNIT["metre",1,ID["EPSG",9001]]],PARAMETER["False easting",0,LENGTHUNIT["metre",1],ID["EPSG",8806]],PARAMETER["False northing",0,LENGTHUNIT["metre",1],ID["EPSG",8807]]],CS[Cartesian,2],AXIS["(E)",east,ORDER[1],LENGTHUNIT["metre",1,ID["EPSG",9001]]],AXIS["(N)",north,ORDER[2],LENGTHUNIT["metre",1,ID["EPSG",9001]]],REMARK["PROJ CRS string: +proj=geos +a=6378137.0 +rf=298.2572221 +lon_0=-137.0 +lat_0=0.0 +h=35786023.0 +x_0=0 +y_0=0 +units=m +sweep=x +no_defs"]]'
clipped_cloud_top = clipped_cloud_top.assign_attrs(cartopy_crs = cartopy_crs_string)
clipped_out = data_dir / "clipped_goes.tif"
if clipped_out.exists():
    clipped_out.unlink()
clipped_cloud_top.rio.to_raster(clipped_out)