48. Clipping issues: What happened to Stanley Park?#
In the Combining goes and landsat data using rioxarray notebook we wound up with a cropped image that shaved off the western and eastern sides of our specified bounding box. As explained in that notebook, that was because we specifed the bounding box corners in lon/lat coords (or equivalently, UTM), but executed rioxarray.clip_box in geostationary coordinates. In this notebook I make two plots, one showing the bounding box in lon/lat coordinates, and one showing it in geostationary coordinates. Because lines of constant longitude are not the same as lines of constant geostationary x values, the clipped bounds differ significantly in the two scenes.
48.1. Installation#
Download clipping_demo.ipynb and three json files from the week9 folder
import cartopy.crs as ccrs
import matplotlib.pyplot as plt
import cartopy
import json
import pyproj
from pathlib import Path
import xarray as xr
from goes2go.data import goes_nearesttime
import numpy as np
/Users/phil/mini310/envs/a301/lib/python3.13/site-packages/goes2go/data.py:673: FutureWarning: 'H' is deprecated and will be removed in a future version. Please use 'h' instead of 'H'.
  within=pd.to_timedelta(config["nearesttime"].get("within", "1h")),
/Users/phil/mini310/envs/a301/lib/python3.13/site-packages/goes2go/NEW.py:185: FutureWarning: 'H' is deprecated and will be removed in a future version. Please use 'h' instead of 'H'.
  within=pd.to_timedelta(config["nearesttime"].get("within", "1h")),
48.2. Read in bounds for landsat and goes#
In Save landsat latlon bounds to a file we wrote the pyproj geostationary crs and the lon/lat bounding boxes out to json files. Read these in so we can start with the same coordinates.
with open("goes_crs.json","r") as infile:
    text_crs = infile.read()
    goes_crs = pyproj.CRS(text_crs)
with open("goes_bounds.json","r") as infile:
    goes_bounds = json.load(infile)
with open("landsat_bounds.json","r") as infile:
    landsat_bounds = json.load(infile)
goes_bounds
{'ll_lon': -123.48500159681677,
 'll_lat': 49.16354952974155,
 'ur_lon': -123.11632714413929,
 'ur_lat': 49.455523852084625}
48.2.1. Make a counterclockwise set of coordinates#
We want to show the bounding box on a map in the two coordinate systems. The x,y keys below start in the ll corner and go around the bounding box counter clockwise. There are 5 values so we return to where we started.
bbox_keys = [('ll_lon','ur_lon','ur_lon','ll_lon','ll_lon'),
                ('ll_lat','ll_lat','ur_lat','ur_lat','ll_lat')]
48.2.2. Find the x,y coorinates for each crs#
Use a list comprehension to group the x and y values together so we can use pyproj.Transformer
lons, lats = bbox_keys
goes_lons_coords = [goes_bounds[key] for key in lons]
goes_lats_coords = [goes_bounds[key] for key in lats]
ls_lons_coords = [landsat_bounds[key] for key in lons]
ls_lats_coords = [landsat_bounds[key] for key in lats]
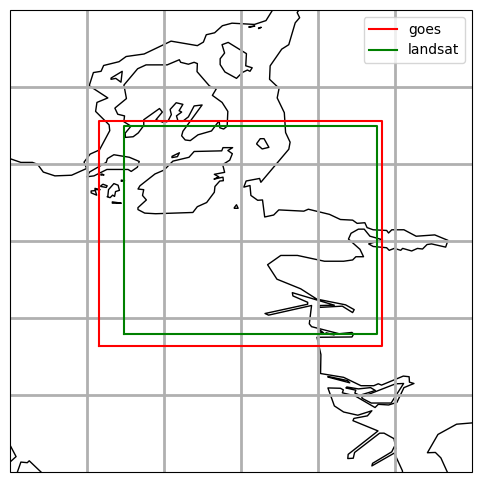
48.3. First Plot: the bounding boxes in lon/lat coords#
Note that in the lon/lat projection the GOES boundary box is actually bigger than the landsat bounding box and includes Stanley Park on the east and Keats Island on the West
# silence geojson warnings
import warnings
warnings.filterwarnings("ignore")
projection = ccrs.PlateCarree()
fig, ax = plt.subplots(1, 1, figsize=(6, 6),
                       subplot_kw={"projection": projection})
#
# set the plot extent to be bigger than geh bounding box
#
xmin, xmax = -123.6,-123.  #longitude degrees east
ymin, ymax = 49,49.6  #latitude degrees north
extent = [xmin,xmax,ymin,ymax]
ax.set_extent(extent)
ax.gridlines(linewidth=2)
ax.plot(goes_lons_coords,goes_lats_coords,'r',label='goes')
ax.plot(ls_lons_coords,ls_lats_coords,'g',label='landsat')
ax.add_feature(cartopy.feature.GSHHSFeature(scale="auto", levels=[1, 2, 3]))
ax.legend(loc='best');
48.4. Redo in geostationary coordinates#
Now try this again, but in a coordinate system where the vertical and horizontal lines are geostationary x and geostationary y instead of longitude and latitude.
48.4.1. Construct the cartopy crs for GOES#
Remember that cartopy is much older than pyproj, and it has its own way of constructing a geostationary coordinate system, so we can’t use a format like wkt (well known text).
I’ll take the values from the pyproj.CRS goes_crs we read in from goes_crs.json above
and rename them so they will be accepted by the cartopy.CRS constructor.
Follow goes2go FieldOfViewAccessor.crs
#
# here's what we have from the json file
#
goes_coeffs = goes_crs.to_dict()
goes_coeffs
{'proj': 'geos',
 'a': 6378137.0,
 'rf': 298.2572221,
 'lon_0': -137.0,
 'lat_0': 0.0,
 'h': 35786023.0,
 'x_0': 0,
 'y_0': 0,
 'units': 'm',
 'sweep': 'x',
 'no_defs': None,
 'type': 'crs'}
48.4.2. move the pyproj params over to cartopy#
Note that pyproj ignores semiminor_axis, which I have to
fill in from reading a goes image and dumping its metadata. This
might explain why the x,y coordinates are slightly different from
goes2go and satpy. The next cell does the translation from pyproj arguments
to cartopy arguments.
#
# had to copy semiminor_axis from a goes2go dataset
# it's not included in the pyproj CRS
#
globe_kwargs = dict(semimajor_axis = goes_coeffs['a'],
                    semiminor_axis=6356752.3141,
                    inverse_flattening = goes_coeffs['rf'])
crs_kwargs = dict(central_longitude = goes_coeffs['lon_0'],
                  satellite_height = goes_coeffs['h'],
                  sweep_axis = 'x')
48.4.3. Call the cartopy.CRS constructors#
cartopy uses the workd globe for what we’ve been calling the datum
globe=ccrs.Globe(ellipse=None, **globe_kwargs)
cartopy_crs = ccrs.Geostationary(**crs_kwargs,globe=globe)
48.4.4. Transform the boundary coords#
Transform the lat/lon boundary into geostationary x,y from epsg 4326
# epsg 4326 is simple geodetic latlon
# we need the always_xy = True because the 4326 default order is lat,lon for some reason
# unlike the other coordinate systems, and that's an accident waiting to happen
latlon_crs = pyproj.CRS.from_epsg(4326)
transformer = pyproj.Transformer.from_crs(latlon_crs,goes_crs,always_xy =True)
goes_x, goes_y = transformer.transform(goes_lons_coords, goes_lats_coords)
48.5. Second plot: the bounding box in geostationary coordinates#
projection = cartopy_crs
fig, ax = plt.subplots(1, 1, figsize=(6, 6),
                       subplot_kw={"projection": projection})
ax.gridlines(linewidth=2)
ax.plot(goes_x,goes_y,'g',label='goes')
ll_x,ll_y = goes_x[0], goes_y[0]
ur_x, ur_y = goes_x[2], goes_y[2]
ax.plot(ll_x,ll_y,'ro',markersize=15,label = 'lower_left')
ax.plot(ur_x,ur_y,'bo',markersize=15,label = 'upper_right')
ax.plot((ll_x,ll_x),(ll_y,ur_y),'r-')
ax.plot((ur_x,ur_x),(ll_y,ur_y),'b-')
ax.add_feature(cartopy.feature.GSHHSFeature(scale="auto", levels=[1, 2, 3]))
fig.legend(bbox_to_anchor=(0.5, 0.25, 0.5, 0.5));
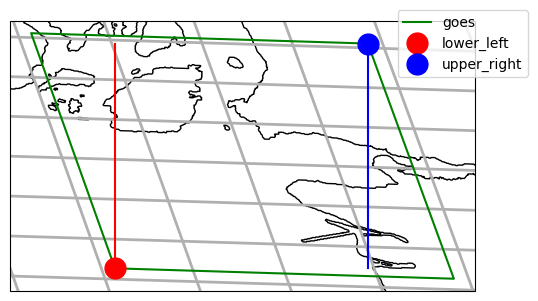
48.6. Summary#
Compare with Plot the resampled image to see why the Stanly Park and Keats Island get clipped. From the cell above it’s clear that the lower left and upper right corners of the bounding box do not give the expected west and east boundaries, which are created along lines of constant longitude, not lines of constant geostationary.x.
Bottom line, if we want to clip along UTM Zone10 or lon/lat boundaries, we have to resample the goes image into that coordinate system, then clip. Alternatively, we need to make the bounding box big enough to get the lower left and upper right corners to span the desired longitude range in geostationary coordinates. rioxarray has the ability to clip to arbitrarily shaped bounding boxes.