45. Combining goes and landsat data using rioxarray#
This is a continuation of Combining goes and landsat data using rioxarray. We’ll switch back from satpy to
goes2go to read in the GOES image, then clip it using rio.clip_box.
The question: Does rio.clip_box give us a better match than satpy.crop for the Landsat 30 km x 24 km bounding box? If not, can we figure out why? The first part of the notebook is identical to the the Landsat section of Find bounds and clip. The GOES section
switches to goes2go to get an xarray file instead of a satpy scene object, and then
turns the xarray DataArray into a rio.DataArray by adding the GOES crs and affine transform.
Finally, I use rio.reproject_match to resample the GOES image to the exact 30 meter Landsat grid, which forces and exact match with the Landsat bounding box.
45.1. Installation#
I’ve updated a301_lib.py to include the data structures and the
find_boundsfunction from Combining goes and landsat data using rioxarray. You’ll need to reinstall the library with:
pip install -r requirements.txt --upgrade
Download goes_landsat_rio.ipynb from the week8 folder
from pathlib import Path
import json

import cartopy
import numpy as np
from matplotlib import pyplot as plt
from pyproj import CRS, Transformer
import rioxarray
import xarray as xr
from cartopy import crs as ccrs
from a301_lib import (
    make_pal,
    Row_col_offsets,
    Clip_point,
    Bounding_box,
    Cartopy_extent,
    find_bounds
    )

import pyproj
import pydantic
from goes2go.data import goes_nearesttime
from datetime import datetime
import affine
import json
/Users/phil/mini310/envs/a301/lib/python3.13/site-packages/goes2go/data.py:673: FutureWarning: 'H' is deprecated and will be removed in a future version. Please use 'h' instead of 'H'.
  within=pd.to_timedelta(config["nearesttime"].get("within", "1h")),
/Users/phil/mini310/envs/a301/lib/python3.13/site-packages/goes2go/NEW.py:185: FutureWarning: 'H' is deprecated and will be removed in a future version. Please use 'h' instead of 'H'.
  within=pd.to_timedelta(config["nearesttime"].get("within", "1h")),
45.2. Get the original hls tif files from disk#
This cell finds all the 3660 x 3660 landsat tifs we downloaded in the satdata/landsat/vancouver folder. We can use the * wildcard
so we don’t have to type in long filenames, and the ** wildcard so we look in all subfolders. If you’re interested here’s
the wikipedia entry on globbing
data_dir = Path().home() / 'repos/a301/satdata/landsat'
the_tifs = list(data_dir.glob('**/vancouver_2023/HLS.L30*tif'))
print(the_tifs)
[PosixPath('/Users/phil/repos/a301/satdata/landsat/vancouver_2023/HLS.L30.T10UDV.2023178T190646.v2.0.Fmask.tif'), PosixPath('/Users/phil/repos/a301/satdata/landsat/vancouver_2023/HLS.L30.T10UDV.2023178T190646.v2.0.B05.tif'), PosixPath('/Users/phil/repos/a301/satdata/landsat/vancouver_2023/HLS.L30.T10UDV.2023178T190646.v2.0.B11.tif'), PosixPath('/Users/phil/repos/a301/satdata/landsat/vancouver_2023/HLS.L30.T10UDV.2023178T190646.v2.0.B10.tif'), PosixPath('/Users/phil/repos/a301/satdata/landsat/vancouver_2023/HLS.L30.T10UDV.2023178T190646.v2.0.B04.tif'), PosixPath('/Users/phil/repos/a301/satdata/landsat/vancouver_2023/HLS.L30.T10UDV.2023178T190646.v2.0.B06.tif'), PosixPath('/Users/phil/repos/a301/satdata/landsat/vancouver_2023/HLS.L30.T10UDV.2023178T190646.v2.0.B07.tif'), PosixPath('/Users/phil/repos/a301/satdata/landsat/vancouver_2023/HLS.L30.T10UDV.2023178T190646.v2.0.B03.tif'), PosixPath('/Users/phil/repos/a301/satdata/landsat/vancouver_2023/HLS.L30.T10UDV.2023178T190646.v2.0.B02.tif'), PosixPath('/Users/phil/repos/a301/satdata/landsat/vancouver_2023/HLS.L30.T10UDV.2023178T190646.v2.0.B01.tif'), PosixPath('/Users/phil/repos/a301/satdata/landsat/vancouver_2023/HLS.L30.T10UDV.2023226T190707.v2.0.Fmask.tif'), PosixPath('/Users/phil/repos/a301/satdata/landsat/vancouver_2023/HLS.L30.T10UDV.2023226T190707.v2.0.B05.tif'), PosixPath('/Users/phil/repos/a301/satdata/landsat/vancouver_2023/HLS.L30.T10UDV.2023178T190646.v2.0.B09.tif')]
45.3. Read band 5 into a dictionary#
Note on the next cell:
Because we set
masked_and_scale=True, all-9999values are changed tonp.nanand the data is multiplied by the scale factor and converted fromint16tofloat32
band_dict={}
for tif_path in the_tifs:
    if 'Fmask' in str(tif_path):
        hls_band = rioxarray.open_rasterio(tif_path,
                                           mask_and_scale=False)
        band_name = 'fmask'
    else:
        hls_band = rioxarray.open_rasterio(tif_path,
                                           mask_and_scale=True)
        band_name = hls_band.long_name
    hls_band = hls_band.squeeze()
    print(f"{band_name=}")
    band_dict[band_name] = hls_band
    if 'unit' in hls_band.attrs:
        print(f"{hls_band.unit=}")
band_name='fmask'
band_name='NIR'
band_name='TIRS2'
hls_band.unit='Celsius'
band_name='TIRS1'
hls_band.unit='Celsius'
band_name='Red'
band_name='SWIR1'
band_name='SWIR2'
band_name='Green'
band_name='Blue'
band_name='Coastal_Aerosol'
band_name='fmask'
band_name='NIR'
band_name='Cirrus'
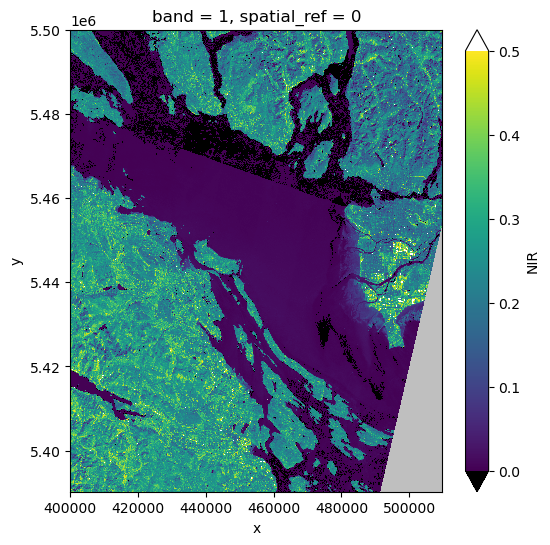
landsat_nir = band_dict['NIR']
landsat_crs = pyproj.CRS(landsat_nir.rio.crs)
fig, ax = plt.subplots(1,1,figsize = (6,6))
vmin = 0.0
vmax = 0.5
pal_dict = make_pal(vmin=vmin,vmax=vmax)
landsat_nir.plot.imshow(ax=ax,
                    norm = pal_dict['norm'],
                    cmap = pal_dict['cmap'],
                    extend = "both");
45.4. Define the image point and boundary offsets#
To make the bounding box, we add column and row offsets to a point that we want in our image, in this case EOSC
ubc_lon = -123.2460 #degrees West
ubc_lat = 49.2606  # degrees North
image_point = Clip_point(lon = ubc_lon, lat = ubc_lat)
#
# remember that rows increase downwards
# make a 1000 row by 800 column (30 km x 24 km) clipped image
#
#
offsets = Row_col_offsets(west = -500,
                south =300,
                east =  300,
                north = -700)
45.5. Find landsat bounds and clip#
landsat_bbox = find_bounds(landsat_nir, offsets, image_point, scene_crs = landsat_crs)
print(landsat_bbox)
xmin=467100.0 ymin=5447460.0 xmax=491100.0 ymax=5477460.0
bounds_list = list(dict(landsat_bbox).values())
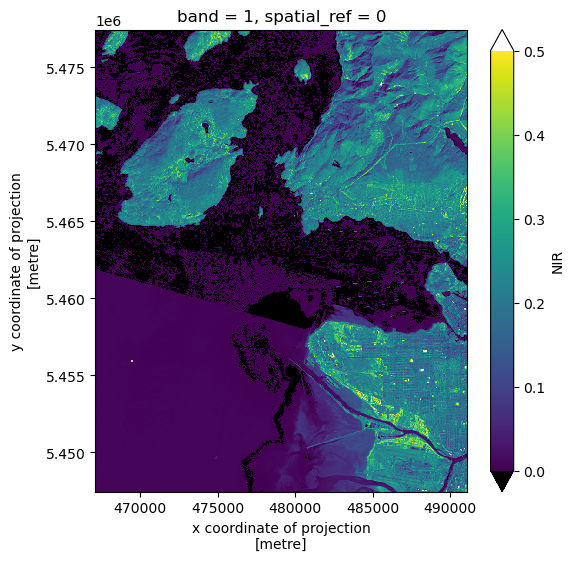
clipped_landsat = landsat_nir.rio.clip_box(*bounds_list)
clipped_landsat.shape
(1000, 800)
fig, ax = plt.subplots(1,1,figsize = (6,6))
clipped_landsat.plot.imshow(ax=ax,
                    norm = pal_dict['norm'],
                    cmap = pal_dict['cmap'],
                    extend = "both");
45.5.1. Save landsat latlon bounds to a file#
Added 2025/Mar7: We need to read these bound in
p_latlon = pyproj.CRS.from_epsg(4326)
xmin,ymin,xmax,ymax = clipped_landsat.rio.bounds()
transform = Transformer.from_crs(landsat_crs, p_latlon, always_xy =True)
xmin_ll,ymin_ll = transform.transform(xmin,ymin)
xmax_ll,ymax_ll = transform.transform(xmax,ymax)
output = dict(ll_lon=xmin_ll,ll_lat=ymin_ll,ur_lon=xmax_ll,ur_lat=ymax_ll)
print(output)
with open("landsat_bounds.json","w") as outfile:
    json.dump(output,outfile)
{'ll_lon': -123.45142791230839, 'll_lat': 49.17906517619593, 'ur_lon': -123.12278960166594, 'ur_lat': 49.44973598679262}
45.5.2. Save clipped image to a tif file#
filename = data_dir / "vancouver_2023/clipped_band5.tif"
clipped_landsat.rio.to_raster(filename)
45.6. Get GOES image#
save_dir = Path.home() / "repos/a301/satdata/goes"
45.6.1. Read the landsat overpass time#
landsat_nir.SENSING_TIME
'2023-08-14T19:07:07.6421900Z; 2023-08-14T19:07:31.5247580Z'
45.6.2. Get the coincident GOES 18 image#
getdata = False
if getdata:
    g = goes_nearesttime(
        datetime(2023, 8, 24, 19), satellite="goes18",product="ABI-L2-MCMIP", domain='C',
          return_as="xarray", save_dir = save_dir, download = True, overwrite = False
    )
    the_path = g.path[0]
else:
    the_path = ("noaa-goes18/ABI-L2-MCMIPC/2023/236/19/"
                "OR_ABI-L2-MCMIPC-M6_G18_s20232361901177"
                "_e20232361903550_c20232361904064.nc")
full_path = save_dir / the_path
45.6.3. Read the image with goes2go#
goesC = xr.open_dataset(full_path,mode = 'r',mask_and_scale = True)
45.6.3.1. Note that the GOES coordinates are not in meters#
print(f"GOES x distance {np.unique(np.diff(goesC.x))}")
GOES x distance [5.5998564e-05 5.6002289e-05 5.6006014e-05 5.6013465e-05]
goesC.cdm_data_type
'Image'
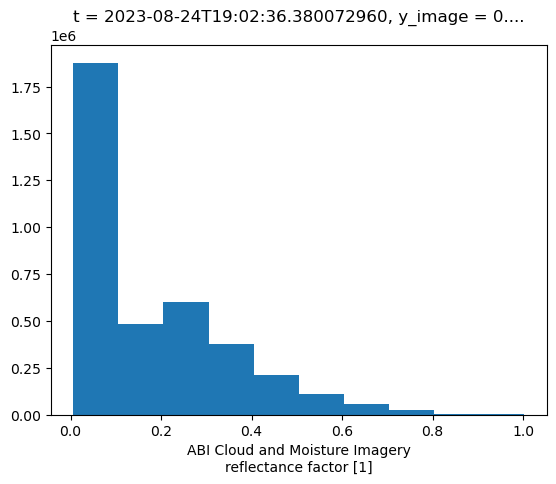
45.6.4. Get the veggie band (C03, nir)#
Note that the channel 3 coordinates are now in meters. This is because the pixel size depends on the channel. The size is larger for the thermal channels. Note that also that the navigation is a little more variable than it was in satpy, where thee pixel sizes only differed in the fifth decimal place, not the first.
c3 = goesC.metpy.parse_cf('CMI_C03')
print(f"GOES x distance {np.unique(np.diff(c3.x))}")
GOES x distance [2003.96589091 2004.09920424 2004.23251756 2004.49914421]
cartopy_crs = c3.metpy.cartopy_crs
goes_crs = pyproj.CRS(cartopy_crs)
goes_coords = dict(c3.coords)
goes_dims = c3.dims
print(c3.dims)
#
# use average pixel size for the transform
#
resolutionx = np.mean(np.diff(c3.x))
resolutiony = np.mean(np.diff(c3.y))
missing = np.float32(np.nan)
print(f"{(resolutionx, resolutiony)=}")
attrs = c3.attrs
attrs['valid_range'] = np.array([0.,1.])
attrs['missing'] = missing
('y', 'x')
(resolutionx, resolutiony)=(np.float64(2004.017317102528), np.float64(-2004.017295251391))
c3.plot.hist();
45.6.5. create the affine transform#
ul_x = c3.x[0].data
ul_y = c3.y[0].data
lr_x = c3.y[-1].data
lr_y = c3.y[-1].data
goes_transform = affine.Affine(resolutionx, 0.0, ul_x, 0.0, resolutiony, ul_y)
goes_transform
Affine(np.float64(2004.017317102528), 0.0, np.float64(-2504019.637719609),
       0.0, np.float64(-2004.017295251391), np.float64(4588197.756226748))
45.6.6. Define make_new_rioxarray#
This function assembles a rioxarray from numpy data plus all the necessary metadata. There are 2 steps:
Create an xarray.DataArray with data, coords, dims, optional attributes and a name (defaults to
name_here)add the rioxarray metdata: crs, transform and optional missing value
def make_new_rioxarray(
    rawdata: np.ndarray,
    coords: dict,
    dims: tuple,
    crs: pyproj.CRS,
    transform: affine.Affine,
    attrs: dict | None = None,
    missing: float | None = None,
    name: str | None = "name_here") -> xr.DataArray:
    """
    create a new rioxarray from an ndarray plus components

    Parameters
    ----------

    rawdata: numpy array
    crs: pyproj crs for scene
    coords: xarray coordinate dict
    dims: x and y dimension names from coorcds
    transform: scene affine transform
    attrs: optional attribute dictionary
    missing: optional missing value
    name: optional variable name, defaults to "name_here"

    Returns
    -------

    rio_da: a new rioxarray
    """
    rio_da=xr.DataArray(rawdata.data,coords=coords,
                            dims=dims,name=name)
    rio_da.rio.write_crs(crs, inplace=True)
    rio_da.rio.write_transform(transform, inplace=True)
    if attrs is not None:
        rio_da=rio_da.assign_attrs(attrs)
    if missing is not None:
        rio_da = rio_da.rio.set_nodata(missing)
    return rio_da
45.6.7. Use make_new_rioxarray to transform c3 into a rioxarray#
goes_c3 = make_new_rioxarray(c3.data, goes_coords, goes_dims,
                    goes_crs, goes_transform, attrs, missing)
print(goes_c3.name)
name_here
45.6.8. Get the full extent of the GOES scene#
xmin, ymin, xmax, ymax = goes_c3.rio.transform_bounds(goes_crs)
goes_extent = xmin, xmax, ymin,ymax
goes_extent
(-2505021.64637816, 2505021.64637816, 1583173.8219972872, 4589199.764874374)
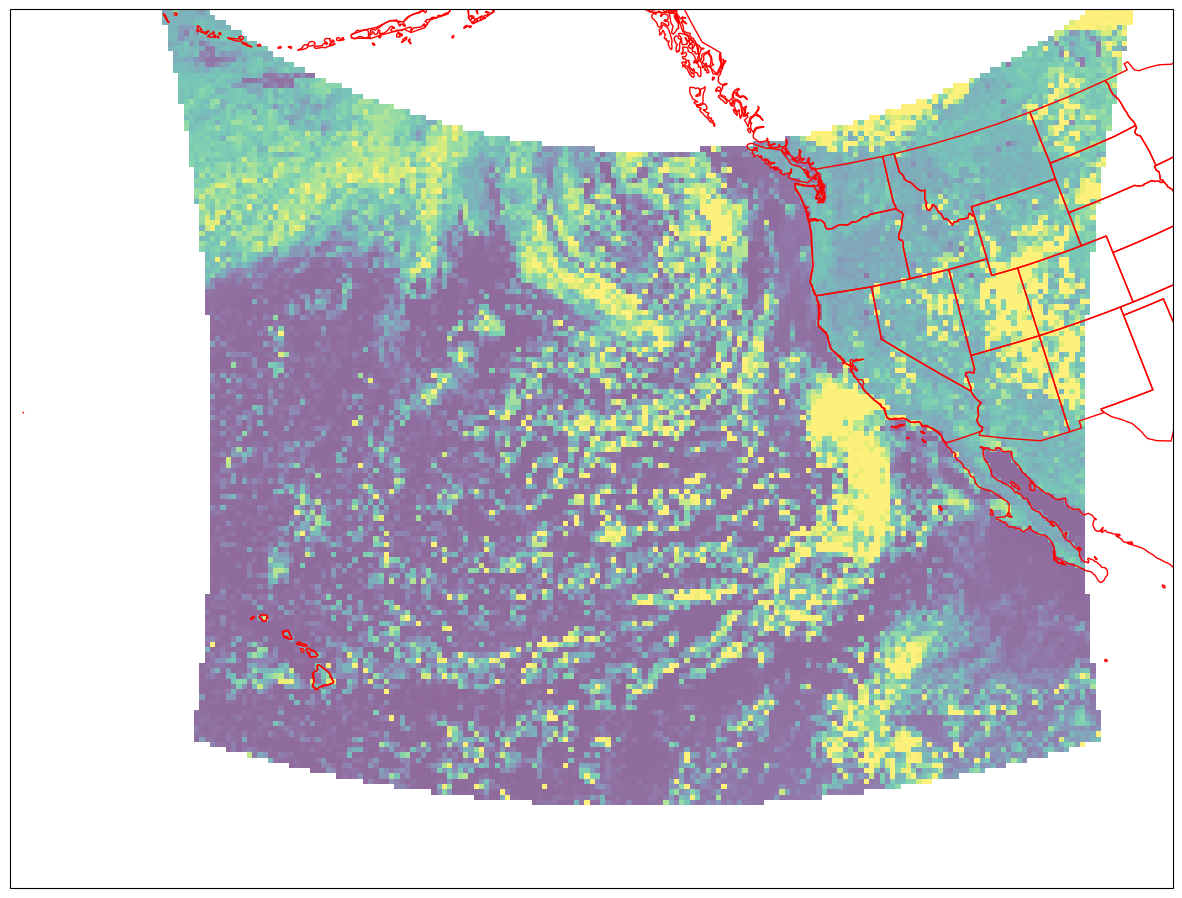
45.6.9. Plot the goes rioxarray#
fig = plt.figure(figsize=(15, 12))
lc = ccrs.LambertConformal(central_longitude= -137)
ax = fig.add_subplot(1, 1, 1, projection=lc)


ax.imshow(
    goes_c3.data,
    origin="upper",
    extent= goes_extent,
    transform=cartopy_crs,
    interpolation="none",
    vmin =0,
    vmax=0.5,
    alpha=0.6
)
ax.set_extent([-170, -110, 10, 55], crs=ccrs.PlateCarree())
ax.coastlines(resolution="50m", color="red", linewidth=1)
ax.add_feature(ccrs.cartopy.feature.STATES, edgecolor="red");
45.7. Now clip the GOES image to Landsat bounds#
45.7.1. Transform the landsat bounds to GOES coords#
We what to clip to the same region as our clipped landsat scene. Note that we still wind up with a shrunken image with the wrong aspec ration
clipped_landsat.shape
(1000, 800)
xmin,ymin,xmax,ymax = clipped_landsat.rio.bounds()
print(f"{(xmax - xmin)=} m")
print(f"{(ymax - ymin)=} m")
#
# transform bounds from landsat to goes crs
#
transform = Transformer.from_crs(landsat_crs, goes_crs)
xmin_goes,ymin_goes = transform.transform(xmin,ymin)
xmax_goes,ymax_goes = transform.transform(xmax,ymax)
print(f"{(xmax_goes - xmin_goes)=} m")
print(f"{(ymax_goes - ymin_goes)=} m")
bounds_goes = xmin_goes,ymin_goes,xmax_goes,ymax_goes
#
# now crop to these bounds using clip_box
#
clipped_c3=goes_c3.rio.clip_box(*bounds_goes)
(xmax - xmin)=24000.0 m
(ymax - ymin)=30000.0 m
(xmax_goes - xmin_goes)=15851.845468400046 m
(ymax_goes - ymin_goes)=14886.105393704027 m
45.7.2. Save goes latlon bounds to a file#
xmin,ymin,xmax,ymax = clipped_c3.rio.bounds()
transform = Transformer.from_crs(goes_crs, p_latlon, always_xy =True)
xmin_ll,ymin_ll = transform.transform(xmin,ymin)
xmax_ll,ymax_ll = transform.transform(xmax,ymax)
output = dict(ll_lon=xmin_ll,ll_lat=ymin_ll,ur_lon=xmax_ll,ur_lat=ymax_ll)
print(output)
with open("goes_bounds.json","w") as outfile:
    json.dump(output,outfile)
{'ll_lon': -123.48500159681677, 'll_lat': 49.16354952974155, 'ur_lon': -123.11632714413929, 'ur_lat': 49.455523852084625}
45.7.3. Save the goes_crs#
with open('goes_crs.json','w') as outfile:
    outfile.write(goes_crs.to_json())
45.8. Verdict: clipped regions still mismatched#
rio.clip_box gives us exactly the same result as satpy.crop in Combining goes and landsat data using rioxarray: the landsat image is 30 km x 24 km and the cropped GOES image is
only 16 km x 18 km and GOES covers only part of the landsat boundary box.
print(f"{(clipped_c3.shape, clipped_landsat.shape)=}")
(clipped_c3.shape, clipped_landsat.shape)=((8, 9), (1000, 800))
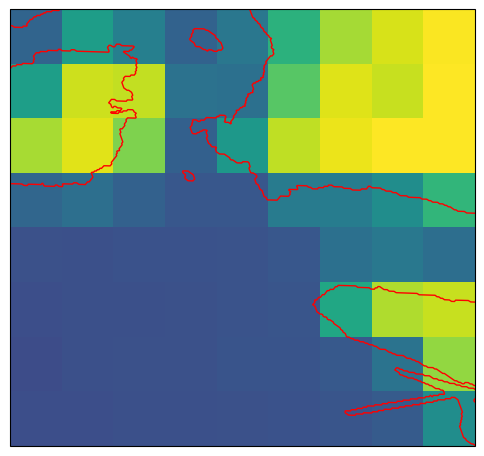
45.8.1. Plot the cropped goes image#
As the plot below shows, it’s an exact match for the result from the last notebook. Note how much lower the GOES band 3 reflectivity is than the Landsat band 5 reflectivity above. That’s because the big GOES pixels contain more mixtures of urban and rural land.
extent_cartopy = xmin_goes,xmax_goes,ymin_goes,ymax_goes
fig2, ax = plt.subplots(1, 1, figsize=(6,6),
                        subplot_kw={"projection": cartopy_crs})
cs = ax.imshow(
    clipped_c3.data,
    origin="upper",
    extent=extent_cartopy,
    transform=cartopy_crs,
    alpha=1,
    vmin=0,
    vmax=0.2
)
ax.set_extent(extent_cartopy,crs=cartopy_crs)
ax.add_feature(cartopy.feature.GSHHSFeature(scale="auto",
                                            levels=[1, 2, 3],edgecolor='red'));
45.9. The solution: resampling#
Resample the GOES image to the Landsat grid gives us aa pixel by pixel comparison that shows why the two domains look different. We use rio.reproject_match to resample the course goes image onto the 1000 x 800 Landsat domain. Every GOES pixel now has exactly the same geographic location as every Landsat pixel.
matched_ds = clipped_c3.rio.reproject_match(clipped_landsat)
matched_ds.shape
(1000, 800)
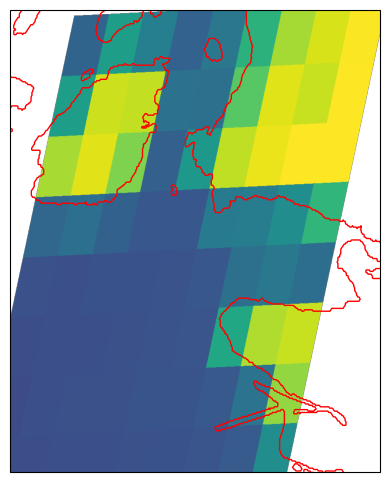
45.9.1. Plot the resampled image#
The resampled image shows what the problem was: the GOES crs is actually tilted with respect to the zone 10N UTM north-south coordinates, so there’s no way to fit the GOES image into the Landsat bounding box without resampling.
epsg_code = matched_ds.rio.crs.to_epsg()
cartopy_crs = ccrs.epsg(epsg_code)
xmin_match,ymin_match,xmax_match,ymax_match = matched_ds.rio.bounds()
extent_cartopy = xmin_match,xmax_match,ymin_match,ymax_match
fig2, ax = plt.subplots(1, 1, figsize=(6,6),
                        subplot_kw={"projection": cartopy_crs})
ax.set_extent(extent_cartopy,crs=cartopy_crs)
cs = ax.imshow(
    matched_ds.data,
    origin="upper",
    extent=extent_cartopy,
    transform=cartopy_crs,
    alpha=1,
    vmin=0,
    vmax=0.2
)

ax.add_feature(cartopy.feature.GSHHSFeature(scale="auto",
                                            levels=[1, 2, 3],edgecolor='red'));
45.10. Summary#
If we want to fill the entire landsat clipped area with GOES data, we’re going to need to increase the size of the GOES bounding box in the east and west directions to make up for the tilt in the coordinate reference system. In general, you need to transform the image into the projection that you want to clip in. If we want to clip along lines of constant longitude, as with UTM or PlateCarree projections, then we need to resample the geostationary image into that coordinate system.