44. Combining goes and landsat data using rioxarray#
2025/March/7: fixed Bug! copied the wrong CRS
44.1. Introduction#
This notebook shows how to clip landsat and goes images to the same bounding box. This could be useful to provide largescale atmospheric context, to check the data, or to fill in missing data (although the pixel sizes are completely different (3 km for GOES and 30 m for Landsat)
New material:
I read the GOES image and crop it to a bounding box using the satpy module
I create a set of python objects to hold the image extent, a point on the image and the bounding box using the [pydantic module](pydantic library
I define a new function
find_boundsthat usestype hintsto specify the required types for function parameters. This extra safety isn’t particularly useful for short programs using Jupyter notebooks, but it is very helpful when writing code that will be put in a library and used by other people. Not required for your assignments, see this type checking guide for more information.
44.1.1. To install#
you’ll need to install satpy and pydantic into the a301 environment
conda install pydantic
conda install satpy
Download goes_landsat.ipynb from the week8 folder
You’ll also need to copy the band 5 hls tif files in the vancouver_2023 folder into a new folder on your drive called
~/repos/a301/satdata/landsat/vancouver_2023
from pathlib import Path
import json

import cartopy
import numpy as np
from matplotlib import pyplot as plt
from pyproj import CRS, Transformer
import rioxarray
import xarray as xr
from cartopy import crs as ccrs
from a301_lib import make_pal
import pyproj
import pydantic
from goes2go.data import goes_nearesttime
from datetime import datetime
/Users/phil/mini310/envs/a301/lib/python3.13/site-packages/goes2go/data.py:673: FutureWarning: 'H' is deprecated and will be removed in a future version. Please use 'h' instead of 'H'.
  within=pd.to_timedelta(config["nearesttime"].get("within", "1h")),
/Users/phil/mini310/envs/a301/lib/python3.13/site-packages/goes2go/NEW.py:185: FutureWarning: 'H' is deprecated and will be removed in a future version. Please use 'h' instead of 'H'.
  within=pd.to_timedelta(config["nearesttime"].get("within", "1h")),
44.2. Get the original hls tif files from disk#
This cell finds all the 3660 x 3660 landsat tifs we downloaded in the satdata/landsat/vancouver folder. We can use the * wildcard
so we don’t have to type in long filenames, and the ** wildcard so we look in all subfolders. If you’re interested here’s
the wikipedia entry on globbing
data_dir = Path().home() / 'repos/a301/satdata/landsat'
the_tifs = list(data_dir.glob('**/vancouver_2023/HLS.L30*tif'))
print(the_tifs)
[PosixPath('/Users/phil/repos/a301/satdata/landsat/vancouver_2023/HLS.L30.T10UDV.2023226T190707.v2.0.Fmask.tif'), PosixPath('/Users/phil/repos/a301/satdata/landsat/vancouver_2023/HLS.L30.T10UDV.2023226T190707.v2.0.B05.tif')]
44.3. Read band 5 into a dictionary#
Note on the next cell:
Because we set
masked_and_scale=True, all-9999values are changed tonp.nanand the data is multiplied by the scale factor and converted fromint16tofloat32
band_dict={}
for tif_path in the_tifs:
    if 'Fmask' in str(tif_path):
        hls_band = rioxarray.open_rasterio(tif_path,
                                           mask_and_scale=False)
        band_name = 'fmask'
    else:
        hls_band = rioxarray.open_rasterio(tif_path,
                                           mask_and_scale=True)
        band_name = hls_band.long_name
    hls_band = hls_band.squeeze()
    print(f"{band_name=}")
    band_dict[band_name] = hls_band
    if 'unit' in hls_band.attrs:
        print(f"{hls_band.unit=}")
band_name='fmask'
band_name='NIR'
landsat_nir = band_dict['NIR']
landsat_crs = pyproj.CRS(landsat_nir.rio.crs)
fig, ax = plt.subplots(1,1,figsize = (6,6))
vmin = 0.0
vmax = 0.5
pal_dict = make_pal(vmin=vmin,vmax=vmax)
landsat_nir.plot.imshow(ax=ax,
                    norm = pal_dict['norm'],
                    cmap = pal_dict['cmap'],
                    extend = "both");
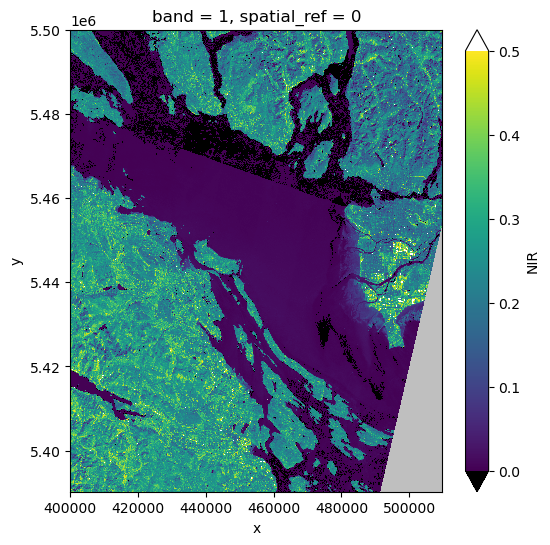
a=band_dict['NIR']
np.unique(np.diff(a.x))
array([30.])
44.4. Make some data container objects#
The pydantic library provides a way to create new python types that enforce the order and the type of their internal data. This helps document the code and avoids errors caused by passing the wrong variables into a function.
from pydantic import BaseModel

class Row_col_offsets(BaseModel):
    """
    row/col offsets needed to define
    rows and column ranges in a region
    """
    west: int
    south: int
    east: int
    north: int

class Clip_point(BaseModel):
    """
    a location within the clipped region
    in geodetic coordinates
    """
    lon: float
    lat: float

class Bounding_box(BaseModel):
    """
    bounding box for rioxarray.clip_box in map coordinates
    """
    xmin: float
    ymin: float
    xmax: float
    ymax: float

class Cartopy_extent(BaseModel):
    """
    cartopy plotting extent in map coords
    """
    xmin: float
    xmax: float
    ymin: float
    ymax: float
44.5. Define the image point and offsets#
To make the bounding box, we add column and row offsets to a point that we want in our image, in this case EOSC
ubc_lon = -123.2460 #degrees West
ubc_lat = 49.2606  # degrees North
image_point = Clip_point(lon = ubc_lon, lat = ubc_lat)
#
# remember that rows increase downwards
# make a 1000 row by 800 column (30 km x 24 km) clipped image
#
#
offsets = Row_col_offsets(west = -500,
                south =300,
                east =  300,
                north = -700)
nir = band_dict['NIR']
44.5.1. Why parameter typing is helpful#
In the box below, the class Clip_point cannot convert the string ‘cinco’ to a float,
and will raise an exception. Passing integers or strings that can be
converted to float will succeed. This becomes much more helpful
when you are trying to use someone’s large library with complex parameters.
# try this
a = 'cinco'
b = '5'
c = 5
d = 5.
#bad = Clip_point(lon = c, lat = a)
ok = Clip_point(lon = d, lat = b)
44.5.2. The find_bounds function#
The function below has a signature with 3 required parameters (scene_ds, offsets, image_point)
and one optional parameter (scene_crs). Each parameter is followed by a type hint, which
tells you the type of the parameter being passed. It is only a hint – the code will run
even if you pass the wrong type, but you can run a separate type checking
program that will catch type mismatches when you call find_bounds in
your code.
def find_bounds(
    scene_ds: xr.DataArray,
    offsets: Row_col_offsets,
    image_point: Clip_point,
    scene_crs: pyproj.CRS | None = None ) -> Bounding_box:
    """
    Given a point in x,y map coordinates and
    a set of row, column offsets, return a
    bounding box that can be used by rio.clip_box to clip
    the image

    Parameters
    ----------
    scene_ds: rioxarray DataArray
    offsets: west, south, east, north
    image_point: lon, lat for point in image
    scene_crs: Optional -- point in scene, if missing use scene_ds.rio.crs

    Returns
    -------

    bounds: west, south, east, north bounds for rio.clip_box
    """
    if scene_crs is None:
        #
        # turn the rasterio CRS into a pyproj.CRS
        #
        scene_crs = pyproj.CRS(scene_ds.rio.crs)
    #
    # step 1: find the image point in utm coords
    # need to transform the latlon point to x,y utm zone 10
    #
    full_affine = scene_ds.rio.transform()
    p_latlon = CRS.from_epsg(4326)
    transform = Transformer.from_crs(p_latlon, scene_crs)
    image_x, image_y = transform.transform(image_point.lat, image_point.lon)
    #
    # step 2: find the row and column of the image point
    #
    image_col, image_row = ~full_affine * (image_x, image_y)
    image_col, image_row = int(image_col), int(image_row)
    #
    # step 3 find the top, bottom, left and right rows and columns
    # given the specified offsets
    #
    col_left, col_right = (image_col + offsets.west, image_col +
                           offsets.east)
    row_bot, row_top = image_row + offsets.south, image_row + offsets.north
    row_max, col_max = scene_ds.shape
    #
    # step 4: sanity check to make sure we haven't gone outside the image
    #
    if (col_left < 0 or col_right > (col_max -1) or
         row_top < 0 or row_bot > (row_max -1)):
        raise ValueError((f"bounds error with "
                          f"{(col_left, col_right, row_bot, row_top)=}"
                          f"\n{scene_ds.shape=}"))
    #
    # step 5: find the x,y corners of the bounding box
    #
    ul_x, ul_y = full_affine * (col_left, row_top)
    lr_x, lr_y = full_affine * (col_right, row_bot)
    #
    # step 6 create a new instance of the Bounding_box object and return it
    #
    bounds = Bounding_box(xmin=ul_x,ymin=lr_y,xmax=lr_x,ymax=ul_y)
    return bounds
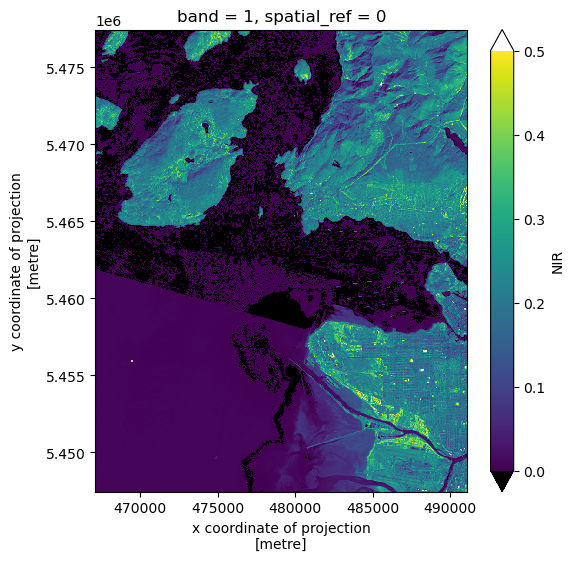
44.6. Find bounds and clip#
landsat_bbox = find_bounds(nir, offsets, image_point, scene_crs = landsat_crs)
print(landsat_bbox)
xmin=467100.0 ymin=5447460.0 xmax=491100.0 ymax=5477460.0
bounds_list = list(dict(landsat_bbox).values())
clipped_ds = landsat_nir.rio.clip_box(*bounds_list)
clipped_ds.shape
(1000, 800)
fig, ax = plt.subplots(1,1,figsize = (6,6))
clipped_ds.plot.imshow(ax=ax,
                    norm = pal_dict['norm'],
                    cmap = pal_dict['cmap'],
                    extend = "both");
44.7. Get GOES image#
save_dir = Path.home() / "repos/a301/satdata/goes"
44.7.1. Read the landsat overpass time#
landsat_nir.SENSING_TIME
'2023-08-14T19:07:07.6421900Z; 2023-08-14T19:07:31.5247580Z'
44.7.2. Get the coincident GOES 18 image#
getdata = False
if getdata:
    g = goes_nearesttime(
        datetime(2023, 8, 24, 19), satellite="goes18",product="ABI-L2-MCMIP", domain='C',
          return_as="xarray", save_dir = save_dir, download = True, overwrite = False
    )
    the_path = g.path[0]
else:
    the_path = ("noaa-goes18/ABI-L2-MCMIPC/2023/236/19/"
                "OR_ABI-L2-MCMIPC-M6_G18_s20232361901177"
                "_e20232361903550_c20232361904064.nc")
full_path = save_dir / the_path
44.7.3. Read the image with satpy#
from satpy import Scene
goes_2023 = Scene(reader= "abi_l2_nc", filenames = list([str(full_path)]))
44.7.4. Get the veggie band (nir)#
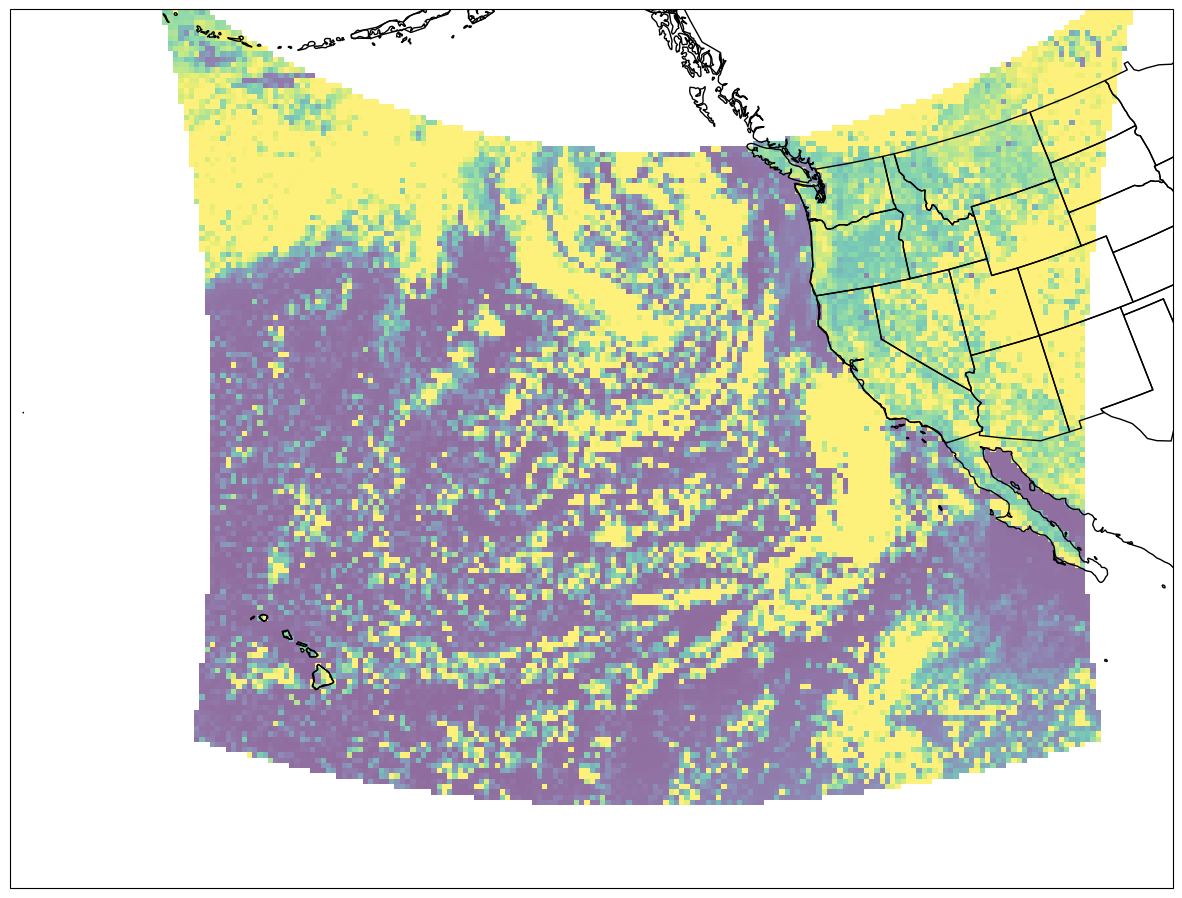
goes_2023.load(['C03'])
c3 = goes_2023['C03']
cartopy_crs = c3.area.to_cartopy_crs()
original_extent = cartopy_crs.bounds
goes_crs = pyproj.CRS(cartopy_crs)
np.unique(np.diff(c3.x))
array([2004.017288, 2004.017288, 2004.017288, 2004.017288])
c3.plot.hist();
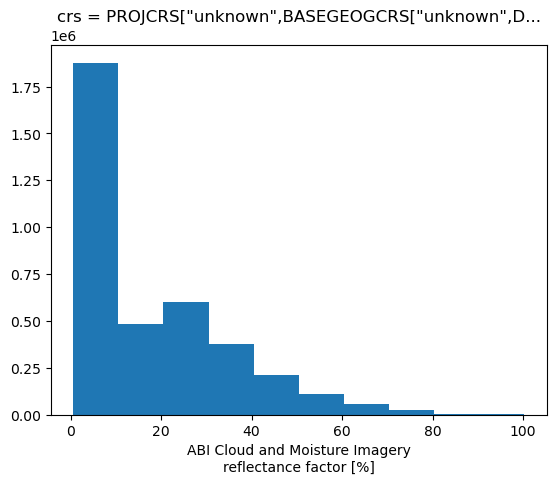
fig = plt.figure(figsize=(15, 12))
lc = ccrs.LambertConformal(central_longitude= -137)
ax = fig.add_subplot(1, 1, 1, projection=lc)


ax.imshow(
    c3.data,
    origin="upper",
    extent=original_extent,
    transform=cartopy_crs,
    interpolation="none",
    vmin =0,
    vmax=30,
    alpha=0.6
)
ax.set_extent([-170, -110, 10, 55], crs=ccrs.PlateCarree())
ax.coastlines(resolution="50m", color="black", linewidth=1)
ax.add_feature(ccrs.cartopy.feature.STATES);
44.8. Transform the landsat bounds to GOES coords#
We what to clip to the same region as our clipped landsat scene
clipped_ds.shape
(1000, 800)
44.8.1. Bug! copied the wrong CRS#
need the clipped crs, not the full scene. The bug was in the next line below
# -> bad: landsat_crs  = nir.rio.crs
xmin,ymin,xmax,ymax = clipped_ds.rio.bounds()
print(f"{(xmax - xmin)=}")
print(f"{(ymax - ymin)=}")
transform = Transformer.from_crs(landsat_crs, goes_crs)
xmin_goes,ymin_goes = transform.transform(xmin,ymin)
xmax_goes,ymax_goes = transform.transform(xmax,ymax)
print(f"{(xmax_goes - xmin_goes)=}")
print(f"{(ymax_goes - ymin_goes)=}")
bounds_goes = xmin_goes,ymin_goes,xmax_goes,ymax_goes
#
# now crop to these bounds
#
cropped_ds=goes_2023.crop(xy_bbox = bounds_goes)
cropped_c3 = cropped_ds['C03']
xmin,ymin,xmax,ymax = cropped_c3.area.area_extent
cropped_c3.shape
(xmax - xmin)=24000.0
(ymax - ymin)=30000.0
(xmax_goes - xmin_goes)=15851.845468400279
(ymax_goes - ymin_goes)=14886.105393704958
(8, 9)
44.9. Verdict: still not a match#
With the bug fixed we’ve got the correct area, but the landsat image is 30 km x 24 km and the cropped GOES image is only 16 km x 18 km. In the next notebook: Combining goes and landsat data using rioxarray we show why there’s a discrepancy.
cropped_c3.shape, clipped_ds.shape
((8, 9), (1000, 800))
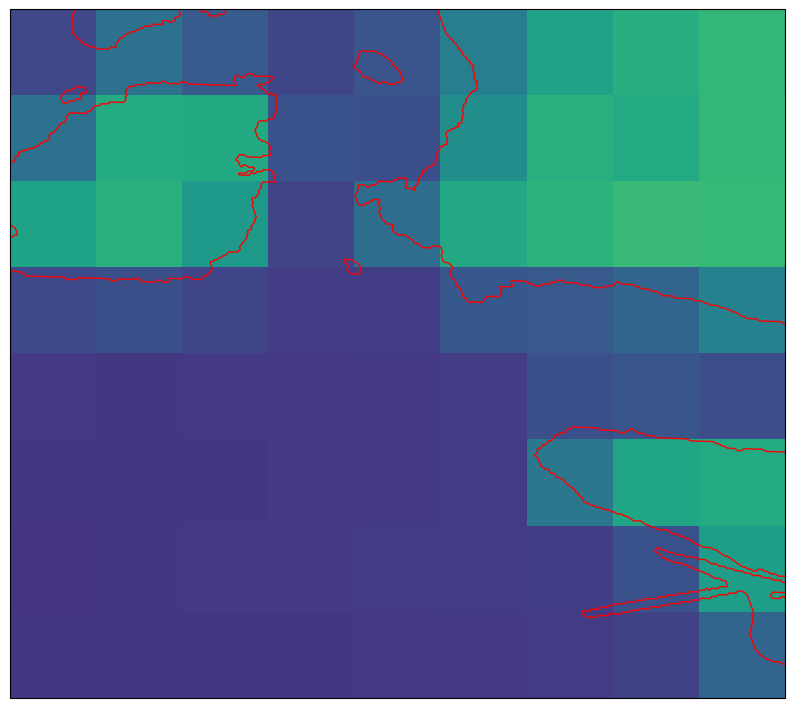
44.9.1. Plot the cropped goes image#
extent_cartopy = xmin,xmax,ymin,ymax
fig2, ax = plt.subplots(1, 1, figsize=(10,10),
                        subplot_kw={"projection": cartopy_crs})
cs = ax.imshow(
    cropped_c3.data,
    origin="upper",
    extent=extent_cartopy,
    transform=cartopy_crs,
    alpha=1,
    vmin=0,
    vmax=30
)
ax.set_extent(extent_cartopy,crs=cartopy_crs)
ax.add_feature(cartopy.feature.GSHHSFeature(scale="auto",
                                            levels=[1, 2, 3],edgecolor='red'));
44.9.2. Next step#
Resample the GOES image to the Landsat grid for a pixel by pixel comparison