58. Assignment 5 solution#
58.1. Question 1#
Turn in a notebook that:
Contains a function function that takes 3 tif files and returns a rioxarray false color image. Use it to make and plot a band 5,4,3 false color png file of your scene
58.1.1. Question 1 answer#
Rather than pass 4 parameters (3 tif files and a list of bands) we’ll skip to the week 10 notebook Landsat 8 false color examples and use the functions define there to pass a dataset containing the necessary bands plus the fmask.
Full source code on github: sat_lib.py
58.1.1.1. To install a301_extras#
pip install git+https://github.com/phaustin/a301_extras --upgrade
def make_false_color(
        the_ds: xarray.Dataset,
        band_names: list[str]) -> xarray.DataArray:
    """
    given a landsat dataset created with at least an fmask and 3 bands,
    return a histogram-equalized false color image with rgb mapped
    to the bands in the order they appear in the list band_names

    example usage:

    landsat_654 = make_false_color(the_ds,['B06','B05','B04'])

    Parameters
    ----------

    the_ds:
       created by make_dataset -- must contain at least 3 bands and Fmask
    band_names:
       list of strings with the names of the bands to be mapped to red, green and blue

    Returns
    -------

    false_color: rioxarray with shape [3,nrows,ncols] that can be converted to png
    """
This is used in Landsat 8 false color examples along with the following:
def make_dataset(
      scene_dict: dict)-> xarray.Dataset:
    """
    given a dictionary with landsat bands stored as rioxarray, keyed by
    the band name, return an rioxarray dataset containing all the bands
    plus metadata

    Parameters
    ----------

    scene_dict: dictionary with keys like 'B03'

    Returns
    -------

    ds_allbands: xarray dataset with all bands from the dictionary stored as variables

    """
and
def make_bool_mask(
      da_fmask:xarray.DataArray
     ) -> NDArray[np.uint8]:
    """'
    turn a Landsat fmask into a boolean 1/0 array where
    cloud-free land pixels are 1 and all other pixels are 0
    For use by skimage.exposure.equalize_hist

    Parameters
    ----------

    da_fmask: the fmask DataArray

    Returns: bool_mask with the same shape
    """
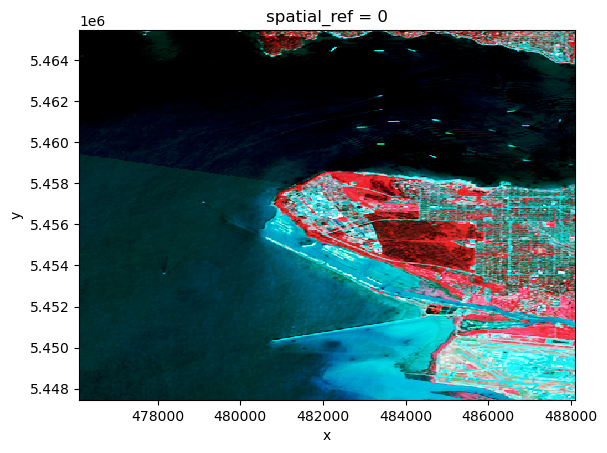
58.1.1.2. Example false color image - Vancouver#
bands={ 'B03':'Green',
        'B04':'Red',
        'B05':'NIR',
        'fmask':'fmask'}
from pathlib import Path
from a301_extras.sat_lib import make_dataset, make_false_color
from matplotlib import pyplot as plt
import rioxarray
import xarray
import numpy as np

data_dir = Path().home() / 'repos/a301/satdata/landsat'
all_tifs = list(data_dir.glob('**/week10*clipped_*.tif'))
scene_dict = {}
for key,bandname in bands.items():
    band_tif = None
    for the_tif in all_tifs:
        if str(the_tif).find(bandname) > -1:
            print(f"reading {key}:{the_tif}")
            if key == 'fmask':
                #
                # don't scale fmask -- needs to be 8 bit
                #
                scene_dict[key] = rioxarray.open_rasterio(the_tif)
            else:
                scene_dict[key] = rioxarray.open_rasterio(the_tif, mask_and_scale=True)
            continue
running __init__.py
reading B03:/Users/phil/repos/a301/satdata/landsat/vancouver_2023/week10/week10_clipped_Green.tif
reading B04:/Users/phil/repos/a301/satdata/landsat/vancouver_2023/week10/week10_clipped_Red.tif
reading B05:/Users/phil/repos/a301/satdata/landsat/vancouver_2023/week10/week10_clipped_NIR.tif
reading fmask:/Users/phil/repos/a301/satdata/landsat/vancouver_2023/week10/week10_clipped_fmask.tif
image_ds = make_dataset(scene_dict)
b543_false = make_false_color(image_ds,['B05','B04','B03'])
b543_false.plot.imshow()
<matplotlib.image.AxesImage at 0x143f68590>
58.2. Question 2#
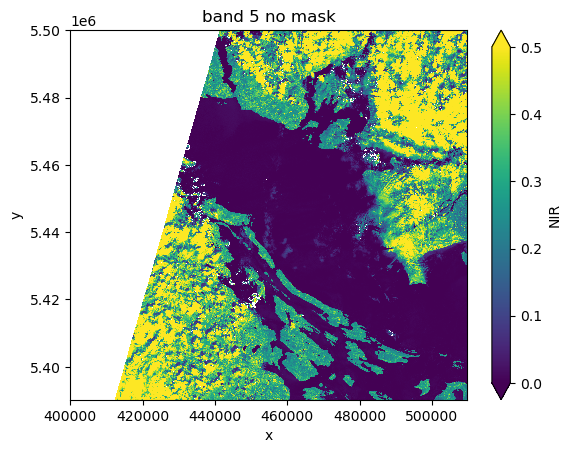
Add to your notebook a function that takes an image and its fmask and returns a new image with all cloudy pixels set to np.nan. Use it to show the image of a partly cloudy scene (any landsat scene you’d like with more than 10% cloud fraction)
data_dir = Path().home() / 'repos/a301/satdata/landsat/vancouver_cloudy'
b5_file = list(data_dir.glob('**/*B05*.tif'))[0]
fmask_file = list(data_dir.glob('**/*Fmask*.tif'))[0]
b5_da = rioxarray.open_rasterio(b5_file, mask_and_scale=True).squeeze()
fmask_da = rioxarray.open_rasterio(fmask_file).squeeze()
b5_da.plot.imshow(vmin=0,vmax=0.5)
ax = plt.gca()
ax.set_title('band 5 no mask');
58.2.1. mask_image function#
Full source code on github: sat_lib.py
def mask_image(
    image_da:xarray.DataArray,
    fmask_da:xarray.DataArray,
    mask_value:np.uint8) -> xarray.DataArray:
    """
    given an image, a bit mask, and a mask value,
    return the modified image with all masked values set to np.nan

    Parameters
    ----------

    image_da: a rioxarray data array with a single band image
    fmask_da: landsat fmask with the same bounding box
    mask_value: bits to mask, like  0b00100011

    Returns
    -------

    masked_da: the overwritten image_da array
    with masked values set to np.nan
    """
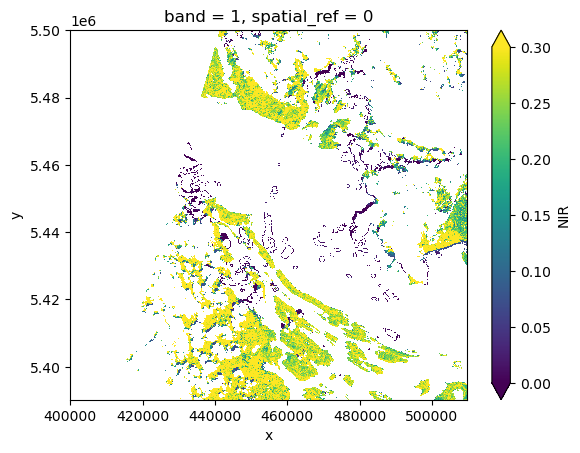
from a301_extras.sat_lib import mask_image
#
# mask clouds and water
#
mask_value = 0b00100011
masked_b5 = mask_image(b5_da,fmask_da,mask_value)
masked_b5.plot.imshow(vmin=0,vmax=0.3)
<matplotlib.image.AxesImage at 0x1441342d0>