23. Clipping multiple bands– v0.3#
2025/Mar/15: Now writes out the fmask file using rasterio (rioxarray doesn’t seem to be able to handle 8 bit data) see
2025/Feb/27: Fixed a problem where the datatype of the clipped arrays was changed from float32 to int16 when creating geotiffs. See Create new clipped arrays for the new code.
23.1. Introduction#
We are going to need to look at bands 2, 3, 4, 5, 9, 10 and 11. This notebook uses the clipped band we wrote in Zooming an image to get the clipping box, then reads in each of these bands, clips to the same box and writes them out to new smaller geotifs.
Download clip_bands.ipynb from the week4 folder
You’ll also need to copy the 5 NASA hls tif files in the vancouver folder into a new folder on your drive called
~/repos/a301/satdata/landsat/vancouver
import copy
import pprint
from pathlib import Path
from osgeo import gdal
import json
import os
import cartopy
import numpy as np
import numpy.random
import rasterio
from affine import Affine
from matplotlib import pyplot as plt
from matplotlib.colors import Normalize
from pyproj import CRS, Transformer
import rioxarray
import xarray as xr
from cartopy import crs as ccrs
from a301_lib import make_pal
import datetime
23.2. Get the original hls tif files from disk#
This cell finds all the 3660 x 3660 landsat tifs we downloaded in the satdata/landsat/vancouver folder. We can use the * wildcard
so we don’t have to type in long filenames, and the ** wildcard so we look in all subfolders. If you’re interested here’s
the wikipedia entry on globbing
data_dir = Path().home() / 'repos/a301/satdata/landsat'
#the_tifs = list(data_dir.glob('**/vancouver_2023/HLS.L30*tif'))
the_tifs = list(data_dir.glob('**/vancouver_2023/HLS.L30*tif'))
print(the_tifs)
[PosixPath('/Users/phil/repos/a301/satdata/landsat/vancouver_2023/HLS.L30.T10UDV.2023178T190646.v2.0.Fmask.tif'), PosixPath('/Users/phil/repos/a301/satdata/landsat/vancouver_2023/HLS.L30.T10UDV.2023178T190646.v2.0.B05.tif'), PosixPath('/Users/phil/repos/a301/satdata/landsat/vancouver_2023/HLS.L30.T10UDV.2023178T190646.v2.0.B11.tif'), PosixPath('/Users/phil/repos/a301/satdata/landsat/vancouver_2023/HLS.L30.T10UDV.2023178T190646.v2.0.B10.tif'), PosixPath('/Users/phil/repos/a301/satdata/landsat/vancouver_2023/HLS.L30.T10UDV.2023178T190646.v2.0.B04.tif'), PosixPath('/Users/phil/repos/a301/satdata/landsat/vancouver_2023/HLS.L30.T10UDV.2023178T190646.v2.0.B06.tif'), PosixPath('/Users/phil/repos/a301/satdata/landsat/vancouver_2023/HLS.L30.T10UDV.2023178T190646.v2.0.B07.tif'), PosixPath('/Users/phil/repos/a301/satdata/landsat/vancouver_2023/HLS.L30.T10UDV.2023178T190646.v2.0.B03.tif'), PosixPath('/Users/phil/repos/a301/satdata/landsat/vancouver_2023/HLS.L30.T10UDV.2023178T190646.v2.0.B02.tif'), PosixPath('/Users/phil/repos/a301/satdata/landsat/vancouver_2023/HLS.L30.T10UDV.2023178T190646.v2.0.B01.tif'), PosixPath('/Users/phil/repos/a301/satdata/landsat/vancouver_2023/HLS.L30.T10UDV.2023226T190707.v2.0.Fmask.tif'), PosixPath('/Users/phil/repos/a301/satdata/landsat/vancouver_2023/HLS.L30.T10UDV.2023226T190707.v2.0.B05.tif'), PosixPath('/Users/phil/repos/a301/satdata/landsat/vancouver_2023/HLS.L30.T10UDV.2023178T190646.v2.0.B09.tif')]
23.3. Examine the geotif metadata#
23.3.1. Using gdalinfo from the terminal#
It turns out that rioxarray only copies part of the metadata into the DataArray. To get all the metadata, we can use the underlying gdal module. Do the following:
open a terminal
cd to the folder holding the geotiff
type
gdalinfo your_tif_name_here.tif
For a shorter summary, you can use the rasterio command line tool rio:
rio info you_tif_name_here.tif
23.3.2. Using the python gdal api#
We can also do that from inside python. To get all the information for the first tif, do:
info = gdal.Info(the_tifs[1], format='json')
info.keys()
/Users/phil/mini310/envs/a301/lib/python3.13/site-packages/osgeo/gdal.py:311: FutureWarning: Neither gdal.UseExceptions() nor gdal.DontUseExceptions() has been explicitly called. In GDAL 4.0, exceptions will be enabled by default.
  warnings.warn(
dict_keys(['description', 'driverShortName', 'driverLongName', 'files', 'size', 'coordinateSystem', 'geoTransform', 'metadata', 'cornerCoordinates', 'wgs84Extent', 'bands', 'stac'])
23.3.3. Dump all the metadata#
You can print the info dictionary to see the full gdal metadata dictionary.
Scanning through it, will see that the metadata key has two sub-keys:
print(f"{info['metadata'].keys()=}")
info['metadata'].keys()=dict_keys(['', 'IMAGE_STRUCTURE'])
And looking at the first key shows all of the metadata that rioxarray transfers to the DataArray attributes. these are the entries that we’ll need to change for our clipped, scaled image. We need to change NCOLS, NROWS, ULX, ULY and scale_factor when we write the clipped geotif. Descriptions of each of the metadata items are in the hls user guide
print(f"{info['metadata'][''].keys()=}")
info['metadata'][''].keys()=dict_keys(['ACCODE', 'add_offset', 'arop_ave_xshift(meters)', 'arop_ave_yshift(meters)', 'arop_ncp', 'arop_rmse(meters)', 'arop_s2_refimg', 'cloud_coverage', 'HLS_PROCESSING_TIME', 'HORIZONTAL_CS_NAME', 'L1_PROCESSING_TIME', 'LANDSAT_PRODUCT_ID', 'LANDSAT_SCENE_ID', 'long_name', 'MEAN_SUN_AZIMUTH_ANGLE', 'MEAN_SUN_ZENITH_ANGLE', 'MEAN_VIEW_AZIMUTH_ANGLE', 'MEAN_VIEW_ZENITH_ANGLE', 'NBAR_SOLAR_ZENITH', 'NCOLS', 'NROWS', 'OVR_RESAMPLING_ALG', 'PROCESSING_LEVEL', 'scale_factor', 'SENSING_TIME', 'SENSOR', 'SENTINEL2_TILEID', 'spatial_coverage', 'SPATIAL_RESOLUTION', 'TIRS_SSM_MODEL', 'TIRS_SSM_POSITION_STATUS', 'ULX', 'ULY', 'USGS_SOFTWARE', '_FillValue', 'AREA_OR_POINT'])
We want to check the long_name key in particular, to make sure we are looking at the right wavelength:
print(f"{info['metadata']['']['long_name']=}")
info['metadata']['']['long_name']='NIR'
The exact wavelength range for each hls landsat band is given in the spectral band table
23.4. Read the bands into a dictionary#
We’re ready to read all of the bands into a dictionary, keyed by the band long_name. All the band names are listed in the
spectral band table. Note one complication – the unit attribute is only present for brightness temperatures, not reflectivities.
Note on the next cell:
Because we set
masked_and_scale=True, all-9999values are changed tonp.nanand the data is multiplied by the scale factor and converted fromint16tofloat32
band_dict={}
for tif_path in the_tifs:
    #
    # skip fmask for now
    #
    if 'Fmask' in str(tif_path):
        hls_band = rioxarray.open_rasterio(tif_path)
        band_name = 'fmask'
        hls_band = hls_band.assign_attrs(long_name='fmask')
        print(f"assigning longname to {band_name}")
    else:
        hls_band = rioxarray.open_rasterio(tif_path,mask_and_scale=True)
        band_name = hls_band.long_name
    print(f"{band_name=},{tif_path=}")
    band_dict[band_name] = hls_band
    if 'unit' in hls_band.attrs:
        print(f"{hls_band.unit=}")
assigning longname to fmask
band_name='fmask',tif_path=PosixPath('/Users/phil/repos/a301/satdata/landsat/vancouver_2023/HLS.L30.T10UDV.2023178T190646.v2.0.Fmask.tif')
band_name='NIR',tif_path=PosixPath('/Users/phil/repos/a301/satdata/landsat/vancouver_2023/HLS.L30.T10UDV.2023178T190646.v2.0.B05.tif')
band_name='TIRS2',tif_path=PosixPath('/Users/phil/repos/a301/satdata/landsat/vancouver_2023/HLS.L30.T10UDV.2023178T190646.v2.0.B11.tif')
hls_band.unit='Celsius'
band_name='TIRS1',tif_path=PosixPath('/Users/phil/repos/a301/satdata/landsat/vancouver_2023/HLS.L30.T10UDV.2023178T190646.v2.0.B10.tif')
hls_band.unit='Celsius'
band_name='Red',tif_path=PosixPath('/Users/phil/repos/a301/satdata/landsat/vancouver_2023/HLS.L30.T10UDV.2023178T190646.v2.0.B04.tif')
band_name='SWIR1',tif_path=PosixPath('/Users/phil/repos/a301/satdata/landsat/vancouver_2023/HLS.L30.T10UDV.2023178T190646.v2.0.B06.tif')
band_name='SWIR2',tif_path=PosixPath('/Users/phil/repos/a301/satdata/landsat/vancouver_2023/HLS.L30.T10UDV.2023178T190646.v2.0.B07.tif')
band_name='Green',tif_path=PosixPath('/Users/phil/repos/a301/satdata/landsat/vancouver_2023/HLS.L30.T10UDV.2023178T190646.v2.0.B03.tif')
band_name='Blue',tif_path=PosixPath('/Users/phil/repos/a301/satdata/landsat/vancouver_2023/HLS.L30.T10UDV.2023178T190646.v2.0.B02.tif')
band_name='Coastal_Aerosol',tif_path=PosixPath('/Users/phil/repos/a301/satdata/landsat/vancouver_2023/HLS.L30.T10UDV.2023178T190646.v2.0.B01.tif')
assigning longname to fmask
band_name='fmask',tif_path=PosixPath('/Users/phil/repos/a301/satdata/landsat/vancouver_2023/HLS.L30.T10UDV.2023226T190707.v2.0.Fmask.tif')
band_name='NIR',tif_path=PosixPath('/Users/phil/repos/a301/satdata/landsat/vancouver_2023/HLS.L30.T10UDV.2023226T190707.v2.0.B05.tif')
band_name='Cirrus',tif_path=PosixPath('/Users/phil/repos/a301/satdata/landsat/vancouver_2023/HLS.L30.T10UDV.2023178T190646.v2.0.B09.tif')
23.4.1. check the dtype of the data and missing data#
band_dict['Green'].dtype, band_dict['Green'].rio.nodata
(dtype('float32'), np.float32(nan))
23.5. Read the clipped week3 band 5 bounding box#
Next we want to get the affine transform from week 3 clipped band file, so we can set the same bounding box for all tifs
23.5.1. Create the bounding box using the upper left and lower right corners#
This should be identical to the bounding box we found in Create the DataArray, which was:
bounding_box=(476100.0, 5447460.0, 488100.0, 5465460.0)
We can get them using the clipped affine transform. Again, we search for the file using wild cards. We just want the first file we find, which means we need convert the python generator returned by glob into a list we can index.
filename =  list(data_dir.glob('**/band5_clipped*'))[0]
print(filename)
clipped_5 = rioxarray.open_rasterio(filename,masked=True)
clipped_transform = clipped_5.rio.transform()
clipped_transform
/Users/phil/repos/a301/satdata/landsat/vancouver/band5_clipped_rio.tif
Affine(30.0, 0.0, 476100.0,
       0.0, -30.0, 5465460.0)
band, nrows, ncols = clipped_5.shape
nrows, ncols
(600, 400)
ul_x, ul_y = clipped_transform * (0, 0)
lr_x, lr_y = clipped_transform * (ncols, nrows)
bounding_box = (ul_x, lr_y, lr_x, ul_y)
print(f"{bounding_box=}")
bounding_box=(476100.0, 5447460.0, 488100.0, 5465460.0)
23.5.2. Get the pyproj crs to copy to output tif#
We want the improved crs we wrote out in Zooming an image for the band5 clipped tif, since it includes the epsg code
good_crs = clipped_5.rio.crs
print(f"{good_crs.to_epsg()=}")
good_crs.to_epsg()=32610
23.6. Create new clipped arrays#
Fixed in version 0.2: Just copying all the metadata from the original NASA files led to issues with missing data values and the ouput datatype for the data. To fix this, create the rioxarray DataArrays from scratch with only those attributes that are consistent with the new mask_and_scaled array. We’ll add more attributes in change some attributes below. In particular note that ULX, ULY, NROWS and NCOLS have not been updated from the original full scene.
def make_new_array(rio_da,crs=None):
    """
    transfer data into from rio_da into a fresh DataArray, copying only the selected metadata
    from rio_da.  This avoids copying old metadata from the original hls tif file

    Parameters
    ----------

    rio_da: xarray DataArray
       a DataArray with rasterio metadata
    crs: optional pyproj crs
       a crs which is able to return its epsg code
       if it's missing, the crs from rio_da will be copied

    Returns
    -------

    clipped_da: xarray.DataArray
      a DataArray with metadata and data copied from rio_da


    """
    #
    # NASA hls files have bad crs, so allow for an override parameter
    #
    print("inside")
    if crs is None:
        crs = rio_da.rio.crs
    clipped_da=xr.DataArray(rio_da.data,coords=rio_da.coords,
                            dims=rio_da.dims)
    clipped_da.rio.write_crs(crs, inplace=True)
    clipped_da.rio.write_transform(rio_da.rio.transform(), inplace=True)
    #print(rio_da.attrs)
    if 'long_name' in rio_da.attrs:
        clipped_da=clipped_da.assign_attrs(rio_da.attrs)
        clipped_da = clipped_da.rio.set_nodata(np.float32(np.nan))
    else:
        attrs = {'long_name' : rio_da.attrs['long_name']}
        print(clipped_da.dtype)
        #clipped_da = clipped_da.rio.set_nodata(None)
        print(f"{clipped_da.rio.long_name}, {type(clipped_da.rio.nodata)}")
    return clipped_da
band_clipped = {}
for key, value in band_dict.items():
    print(value.long_name)
    the_array = value.rio.clip_box(*bounding_box)
    new_clipped = make_new_array(the_array,crs = good_crs)
    band_clipped[key]=new_clipped
fmask
inside
NIR
inside
TIRS2
inside
TIRS1
inside
Red
inside
SWIR1
inside
SWIR2
inside
Green
inside
Blue
inside
Coastal_Aerosol
inside
Cirrus
inside
var='fmask'
fmask = band_clipped[var]
#fmask.rio.to_raster("test_fmask.tif")
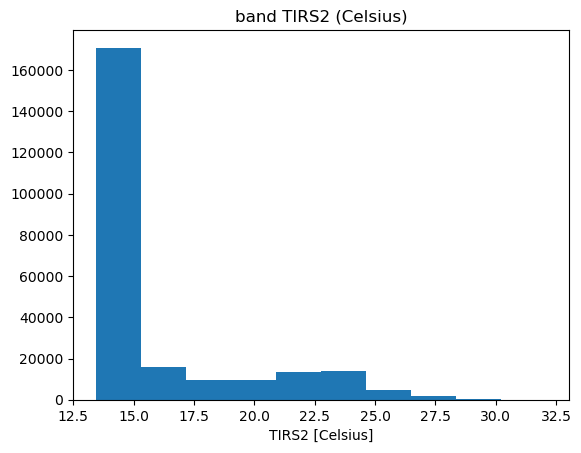
23.7. Check the brightness temperature in band 11#
print(band_clipped[key].rio.nodata)
nan
key = 'TIRS2'
fig, ax = plt.subplots(1,1)
band_clipped[key].plot.hist(ax = ax)
ax.set_title(f"band {key} ({band_dict[key].unit})")
Text(0.5, 1.0, 'band TIRS2 (Celsius)')
23.8. Write the clipped geotiffs#
Put these into the vancouver folder. We can copy code from add the transform and the crs
23.8.1. change some attributes#
We need to adjust some of the attributions for the new subscene. To do this, copy the exiting attributes into a dictionary and rewrite the parts you want to change, adding any extras.
band_clipped['Red'].dtype,band_clipped['Red'].rio.nodata
(dtype('float32'), np.float32(nan))
value.rio.set_nodata(np.float32(np.nan),inplace=True)
type(value.rio._nodata)
numpy.float32
for key, value in band_clipped.items():
    new_attrs = copy.deepcopy(value.attrs)
    new_attrs['ULX']= ul_x
    new_attrs['ULY'] = ul_y
    band, nrows, ncols = value.shape
    new_attrs['NROWS'] = nrows
    new_attrs['NCOLS'] = ncols
    # new_attrs['FillValue'] = np.nan
    new_attrs['history'] = "v0.3 -- written by the week4 clip_bands notebook"
    value.rio.update_attrs(new_attrs, inplace = True)
    #
    # update_attrs seems to destroy the rio.nodata attribute
    #
    value.rio.set_nodata(np.float32(np.nan),inplace=True);
23.8.1.1. check the attributes#
value.attrs['history'],value.dtype,value.rio.nodata
('v0.3 -- written by the week4 clip_bands notebook',
 dtype('float32'),
 np.float32(nan))
23.8.2. Write out the new geotiffs#
band_clipped['fmask'][0,-1,-10:]
<xarray.DataArray (x: 10)> Size: 10B
array([128, 128, 128, 128, 128, 192, 192, 192, 192, 192], dtype=uint8)
Coordinates:
    band         int64 8B 1
  * x            (x) float64 80B 4.878e+05 4.878e+05 ... 4.881e+05 4.881e+05
    y            float64 8B 5.447e+06
    spatial_ref  int64 8B 0
Attributes: (12/38)
    ACCODE:                    Lasrc; Lasrc
    arop_ave_xshift(meters):   0, 0
    arop_ave_yshift(meters):   0, 0
    arop_ncp:                  0, 0
    arop_rmse(meters):         0, 0
    arop_s2_refimg:            NONE
    ...                        ...
    AREA_OR_POINT:             Area
    scale_factor:              1.0
    add_offset:                0.0
    long_name:                 fmask
    _FillValue:                255
history: v0.3 -- written by the week4 clip_bands notebook23.8.3. New function: write_fmask#
need to call rasterio directly since rioxarray can’t handle 8 bit data
def write_fmask(
      filename: str | os.PathLike,
       da_value: xr.DataArray) -> None:
    """
    use rasterio to write out the clipped fmask

    Parameter:

    """

    data = da_value.data.squeeze()
    dtype = data.dtype
    crs = da_value.rio.crs
    transform = fmask.rio.transform()
    with rasterio.open(
        filename,
        'w',
        driver='GTiff',
        height=data.shape[0],
        width=data.shape[1],
        count=1,  # Number of bands
        dtype=dtype,  # Data type (8-byte float)
        crs=crs,  # Coordinate Reference System (WGS84)
        transform=transform
    ) as dst:
        dst.write(data, 1)  # Write the array to the first band
        dst.update_tags(
            history="written by a301_extras/write_fmask",
            written_on=str(datetime.date.today()),
        )
        dst.update_tags(1,long_name="fmask")
for key, value in band_clipped.items():
    band_name = value.long_name
    print(f"{band_name=}")
    tif_filename = data_dir / 'vancouver' / f"week10_clipped_{band_name}.tif"
    #
    # remove the file if it already exists
    #
    if tif_filename.exists():
        tif_filename.unlink()
    if value.long_name == 'fmask':
        write_fmask(tif_filename,value)
    else:
        value.rio.to_raster(tif_filename)
band_name='fmask'
band_name='NIR'
band_name='TIRS2'
band_name='TIRS1'
band_name='Red'
band_name='SWIR1'
band_name='SWIR2'
band_name='Green'
band_name='Blue'
band_name='Coastal_Aerosol'
band_name='Cirrus'
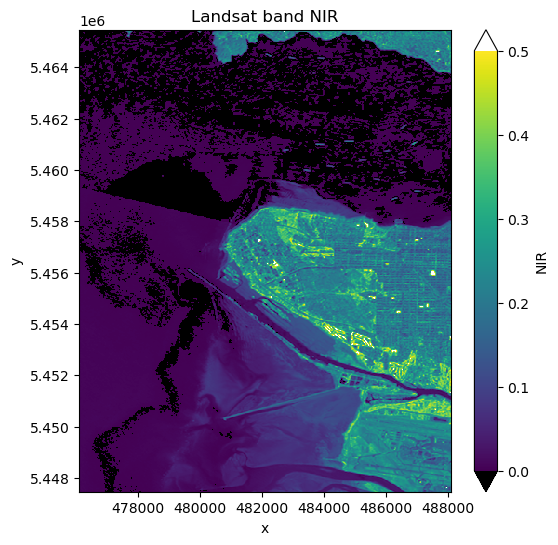
23.8.4. read one back in to check#
filename = tif_filename = data_dir / 'vancouver' / f"week10_clipped_fmask.tif"
fmask =  rioxarray.open_rasterio(filename,masked=False)
fmask
<xarray.DataArray (band: 1, y: 600, x: 400)> Size: 240kB
[240000 values with dtype=uint8]
Coordinates:
  * band         (band) int64 8B 1
  * x            (x) float64 3kB 4.761e+05 4.761e+05 ... 4.881e+05 4.881e+05
  * y            (y) float64 5kB 5.465e+06 5.465e+06 ... 5.448e+06 5.447e+06
    spatial_ref  int64 8B 0
Attributes:
    history:        written by a301_extras/write_fmask
    written_on:     2025-03-17
    AREA_OR_POINT:  Area
    long_name:      fmask
    scale_factor:   1.0
add_offset: 0.0tif_filename = list(data_dir.glob("**/*week10*NIR.tif"))[0]
print(f"{tif_filename=}")
has_file = tif_filename.exists()
if not has_file:
raise IOError(f"can't find {filename}, something went wrong above")
small_band = rioxarray.open_rasterio(tif_filename,mask_and_scale=True)
print(f"{small_band.data[0,-1,-10:]=}")
small_band = small_band.squeeze()
band_name = small_band.long_name
print(f"{(band_name, small_band.dtype)=}")
fig, ax = plt.subplots(1,1, figsize=(6,6))
vmin, vmax = 0.,0.5
pal_dict = make_pal(vmin=vmin,vmax=vmax)
small_band.plot.imshow(ax=ax,
norm = pal_dict['norm'],
cmap = pal_dict['cmap'],
extend = "both")
ax.set_title(f"Landsat band {band_name}");
tif_filename=PosixPath('/Users/phil/repos/a301/satdata/landsat/vancouver/week10_clipped_NIR.tif')
small_band.data[0,-1,-10:]=array([0.227     , 0.2357    , 0.19999999, 0.2024    , 0.213     ,
       0.1812    , 0.2015    , 0.2394    , 0.23099999, 0.2409    ],
      dtype=float32)
(band_name, small_band.dtype)=('NIR', dtype('float32'))
small_band.attrs['history']
'v0.3 -- written by the week4 clip_bands notebook'
23.8.4.1. note that we now have the correct epsg code#
Because we used the pyproj good_crs in our raster write we’ve fixed the missing epsg code problem.
small_band.rio.crs.to_epsg(), small_band.rio.nodata,small_band.dtype
(32610, np.float32(nan), dtype('float32'))
23.8.4.2. Check the metadata#
Write all the metadata out to a file for a detailed check
info = gdal.Info(tif_filename, format='json')
print(f"{tif_filename=}")
with open('dump.json','w') as fp:
    json.dump(info,fp,indent=4)
tif_filename=PosixPath('/Users/phil/repos/a301/satdata/landsat/vancouver/week10_clipped_NIR.tif')