68. Comparing cloudtop and 11 \(\mu m\) temperatures#
68.1. Introduction#
In this notebook we look at the difference between the cloud top temperature (the variable TEMP in the product ABI-L2-ACHTF) and the Channel 14 11 \(\mu m\) brightness
temperature (the variable CMI-C14 in the product ABI-L2-MCMIPC).
We can only compare the two temperatures for cloud pixels, so we also need to get the
cloud mask, which is the variable Cloud_Probabilities in the product ABI-L2-ACMC.
Here is the list of all GOES products
It turns out that the cloud top temperature is only available hourly for the full disk, not the continental us. As a result the closest times are different between the cloud top temperature and channel 14 variables. In the cells below we:
Read in the three datasets
Convert them to rioxarrays with transforms, crs, dims, coords
Crop all three to the same bounding box
Reproject cloud_top_temp to the same grid as Chan14 and the cloud mask.
Histogram the cloud_top_temp - Chan14 temperature difference for the masked pixels
Question Do you expect the cloudtop temperatures to be warmer, colder or the same temperature as the Channel 14 window temperatures?
68.2. Installation#
fetch and rebase to pick up the week12 folder with this ipynb file
pip install -r requirements.txtto install the newest version of thea301_extraslibrary
from pathlib import Path
import xarray as xr
import numpy as np
import pyproj
from matplotlib import pyplot as plt
import datetime
import pytz
import pandas as pd
from pyproj import CRS, Transformer
import affine
from a301_extras.sat_lib import make_new_rioxarray
import cartopy.crs as ccrs
import cartopy.feature as cfeature
running __init__.py
save_dir = Path.home() / "repos/a301/satdata/earthcare"
68.2.1. set the time and bounding box corners#
Copy these from goes-earthcare overlay
xmin = -145
xmax = -85.
ymin = 22.
ymax = 70
timestamp = pd.Timestamp('2024-12-13 22:50:35.447906')
68.3. Find the nearest GOES MCMIP image#
68.3.1. Function get_goes#
from goes2go import goes_nearesttime

def get_goes(timestamp, satellite="goes16", product="ABI-L2-MCMIP",domain="C",
             download=True, save_dir=None):
    g = goes_nearesttime(
        timestamp, satellite=satellite,product=product, domain=domain,
          return_as="xarray", save_dir = save_dir, download = download, overwrite = False
    )
    the_path = g.path[0]
    return the_path
/Users/phil/mini310/envs/a301/lib/python3.13/site-packages/goes2go/data.py:673: FutureWarning: 'H' is deprecated and will be removed in a future version. Please use 'h' instead of 'H'.
  within=pd.to_timedelta(config["nearesttime"].get("within", "1h")),
/Users/phil/mini310/envs/a301/lib/python3.13/site-packages/goes2go/NEW.py:185: FutureWarning: 'H' is deprecated and will be removed in a future version. Please use 'h' instead of 'H'.
  within=pd.to_timedelta(config["nearesttime"].get("within", "1h")),
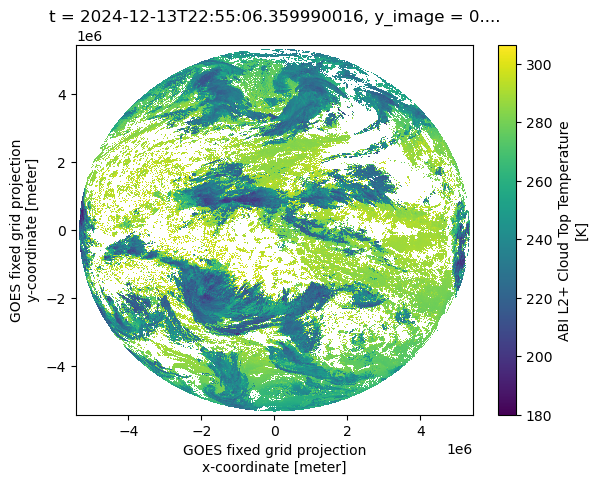
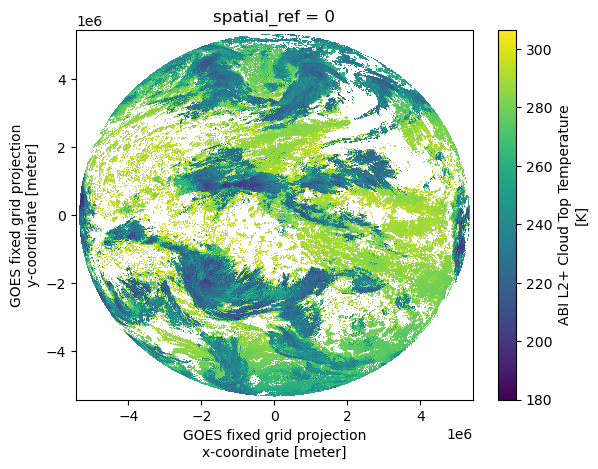
68.4. Get the cloud top temperature#
The variable Temp is in the ABI-L2-ACHTF product, at 2 km resolution. It is available every 15 minutes, but only for the full disk. It is calculated by the same algorithm that computes the cloud top pressure and height.
download_dict = dict(satellite="goes18",product = "ABI-L2-ACHTF",domain="C",
                     save_dir=save_dir)
writeit = False
if writeit:
    the_path = get_goes(timestamp,**download_dict)
else:
    the_path = ('noaa-goes18/ABI-L2-ACHTF/2024/348/22/OR_ABI-L2-ACHTF-M6_G18_s20243482250209'
                '_e20243482259517_c20243482301529.nc'
               )
full_path = save_dir / the_path
the_path
'noaa-goes18/ABI-L2-ACHTF/2024/348/22/OR_ABI-L2-ACHTF-M6_G18_s20243482250209_e20243482259517_c20243482301529.nc'
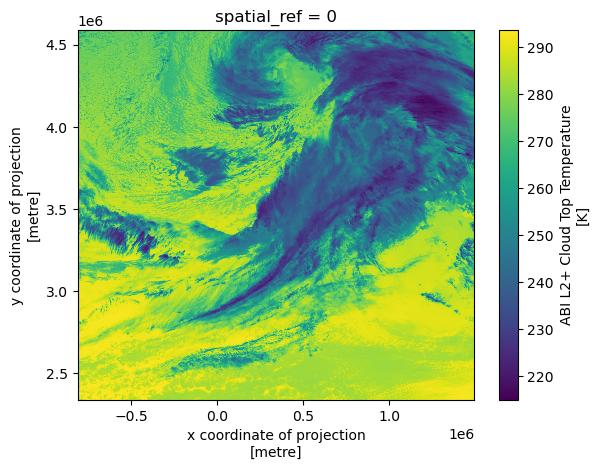
goes_ct = xr.open_dataset(full_path,mode = 'r',mask_and_scale = True)
cloud_temp = goes_ct.metpy.parse_cf('TEMP')
cloud_temp.plot.imshow();
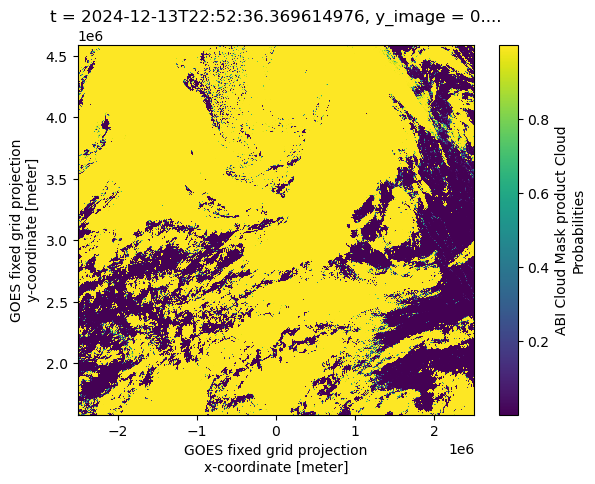
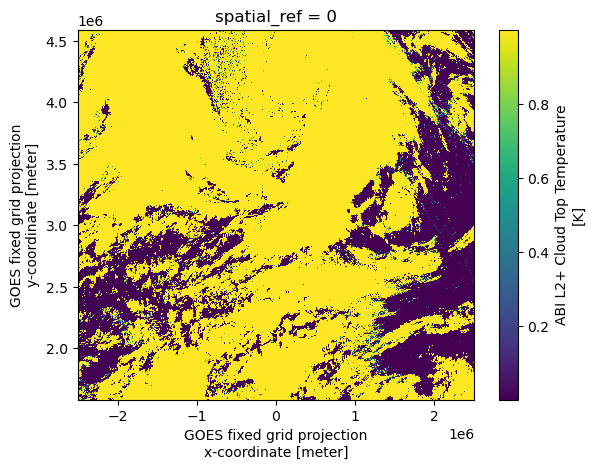
68.5. Get the cloud probability#
The Cloud_Probabilities variable is in the ABI-L2-ACMC product, at 2 km resolution. It is available every 15 minutes. The
full description is here.
download_dict = dict(satellite="goes18",product = "ABI-L2-ACMC",domain="C",
                     save_dir=save_dir)
writeit = False
if writeit:
    the_path = get_goes(timestamp,**download_dict)
else:
    the_path = ('noaa-goes18/ABI-L2-ACMC/2024/348/22/OR_ABI-L2-ACMC-M6_G18'
                '_s20243482251177_e20243482253550_c20243482254451.nc'
               )
full_path = save_dir / the_path
the_path
'noaa-goes18/ABI-L2-ACMC/2024/348/22/OR_ABI-L2-ACMC-M6_G18_s20243482251177_e20243482253550_c20243482254451.nc'
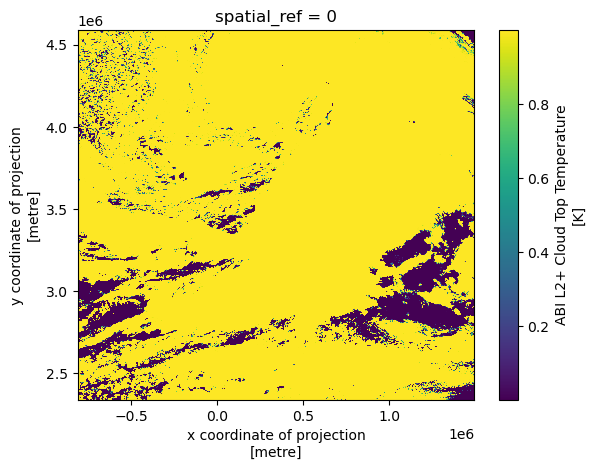
goes_mask = xr.open_dataset(full_path,mode = 'r',mask_and_scale = True)
cloud_prob = goes_mask.metpy.parse_cf('Cloud_Probabilities')
cloud_prob.plot.imshow();
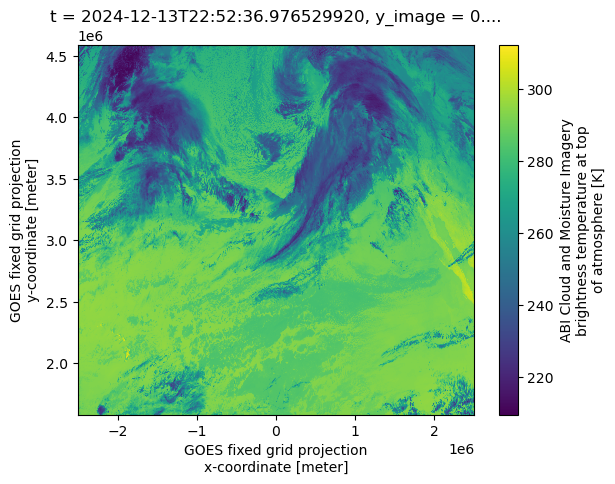
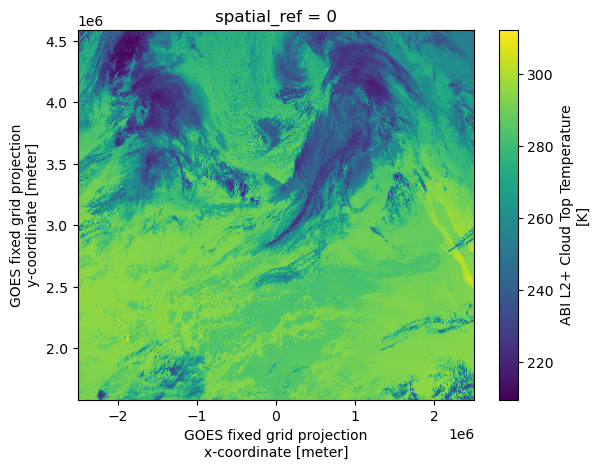
68.6. Get the 11 micron thermal band – channel 14#
This is channel 14 (CMI-C14) in the
moisture and cloud product MCMIPC. The brightness temperature has 2 km resolution,
but unlike the TEMP variable, there is no atmospheric correction for water vapor above the cloud.
download_dict = dict(satellite="goes18",
                     product = "ABI-L2-MCMIPC",save_dir=save_dir)
writeit = False
if writeit:
    the_path = get_goes(timestamp,**download_dict)
else:
    the_path = ('noaa-goes18/ABI-L2-MCMIPC/2024/348/22/OR_ABI-L2-MCMIPC-M6_G18_s20243482251177'
                '_e20243482253562_c20243482254081.nc'
               )
full_path = save_dir / the_path
the_path
'noaa-goes18/ABI-L2-MCMIPC/2024/348/22/OR_ABI-L2-MCMIPC-M6_G18_s20243482251177_e20243482253562_c20243482254081.nc'
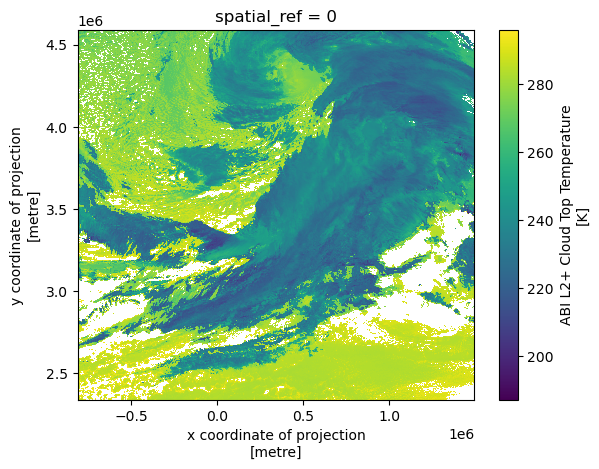
goes_mc = xr.open_dataset(full_path,mode = 'r',mask_and_scale = True)
chan_14 = goes_mc.metpy.parse_cf('CMI_C14')
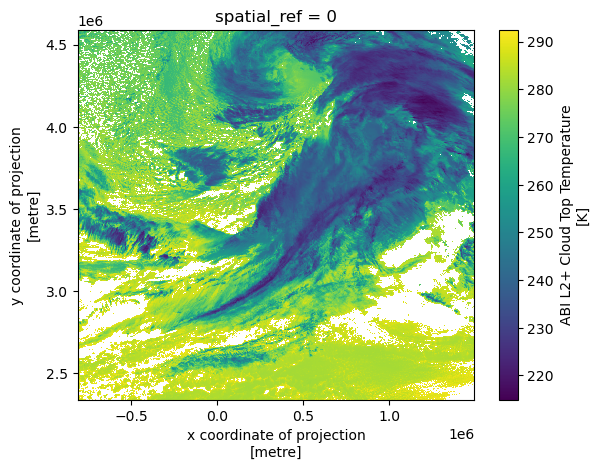
chan_14.plot.imshow();
68.7. Calculate the affine transforms#
68.7.1. Function get_affine#
def get_affine(goes_da):
    resolutionx = np.mean(np.diff(goes_da.x))
    resolutiony = np.mean(np.diff(goes_da.y))
    ul_x = goes_da.x[0].data
    ul_y = goes_da.y[0].data
    goes_transform = affine.Affine(resolutionx, 0.0, ul_x, 0.0, resolutiony, ul_y)
    return goes_transform
68.7.2. Note the cloud_temp affine transform has a diffrent resolution and corner coords#
cloud_temp_affine = get_affine(cloud_temp)
chan_14_affine = get_affine(chan_14)
cloud_prob_affine = get_affine(cloud_prob)
chan_14_affine,  cloud_prob_affine, cloud_temp_affine
(Affine(np.float64(2004.017317102528), 0.0, np.float64(-2504019.637719609),
        0.0, np.float64(-2004.017295251391), np.float64(4588197.756226748)),
 Affine(np.float64(2004.017317102528), 0.0, np.float64(-2504019.637719609),
        0.0, np.float64(-2004.017295251391), np.float64(4588197.756226748)),
 Affine(np.float64(2004.0172201085857), 0.0, np.float64(-5433892.69232443),
        0.0, np.float64(-2004.0172201085857), np.float64(5433892.69232443)))
chan_14.shape, cloud_prob.shape, cloud_temp.shape
((1500, 2500), (1500, 2500), (5424, 5424))
68.8. convert cloud_temp to a rioxarray#
Use make_new_rioxarray introduced in Combining goes and landsat data using rioxarray
68.8.1. Set the attributes#
def get_goes_attributes(goes_da,title="no title", history="no history"):
    attribute_names=['long_name','standard_name','units','grid_mapping']
    attributes ={name:item for name,item in cloud_temp.attrs.items()
                 if name in attribute_names}
    attributes['history'] = f"{history}:{datetime.datetime.now()}"
    attributes['start'] = goes_ct.attrs['time_coverage_start']
    attributes['end'] = goes_ct.attrs['time_coverage_end']
    attributes['dataset'] = goes_ct.attrs['dataset_name']
    attributes['title'] = title
    return attributes
68.8.2. Create the rioxarray#
attributes = get_goes_attributes(cloud_temp, history="written by goes_temperature.ipynb",
                                 title="goes cloud top temperature (K)")
the_dims = ('y','x')
goes_crs = cloud_temp.metpy.pyproj_crs
coords_cloud_temp = dict(x=cloud_temp.x,y=cloud_temp.y)
cloud_temp_da = make_new_rioxarray(cloud_temp,
                                  coords_cloud_temp,
                                  the_dims,
                                  goes_crs,
                                  cloud_temp_affine,
                                  attrs = attributes,
                                  missing=np.float32(np.nan),
                                  name = 'ht')
cloud_temp_da.plot.imshow()
<matplotlib.image.AxesImage at 0x14e1d65d0>
68.9. convert chan_14 to a rioxarray#
68.9.1. set chan_14 attributes#
attributes = get_goes_attributes(cloud_temp, history="written by goes_temperature.ipynb",
                                 title="goes channel 14 brightness temperature (K)")
the_dims = ('y','x')
goes_crs = cloud_temp.metpy.pyproj_crs
coords_chan_14 = dict(x=chan_14.x,y=chan_14.y)
chan_14_da = make_new_rioxarray(chan_14,
                                  coords_chan_14,
                                  the_dims,
                                  goes_crs,
                                  chan_14_affine,
                                  attrs = attributes,
                                  missing=np.float32(np.nan),
                                  name = 'chan_14')
chan_14_da.plot.imshow();
68.10. Convert cloud_prob to a rioxarray#
attributes = get_goes_attributes(cloud_temp, history="written by goes_temperature.ipynb",
                                 title="goes cloud probability")
the_dims = ('y','x')
goes_crs = cloud_prob.metpy.pyproj_crs
coords_cloud_prob = dict(x=cloud_prob.x,y=cloud_prob.y)
cloud_prob_da = make_new_rioxarray(cloud_prob,
                                  coords_cloud_prob,
                                  the_dims,
                                  goes_crs,
                                  cloud_prob_affine,
                                  attrs = attributes,
                                  missing=np.float32(np.nan),
                                  name = 'cloud_probability')
cloud_prob_da.plot.imshow() ;
68.11. crop the images#
We want to crop the images to the west coast. To do that, we first need to get
the bounding box in geostationary coordinates, so we can use the rio.clip_box function. We did this in week 8 in Now clip the GOES image to Landsat bounds
68.11.1. lon, lat bounds#
xmin,ymin,xmax,ymax
(-145, 22.0, -85.0, 70)
68.11.2. Transform the bounds from lat/lon to geostationary crs#
Resulting image is 2304 km wide x 2861 km tall
#
# transform bounds from lat,lon to goes crs
#
latlon_crs = pyproj.CRS.from_epsg(4326)
transform = Transformer.from_crs(latlon_crs, goes_crs,always_xy=True)
xmin_goes,ymin_goes = transform.transform(xmin,ymin)
xmax_goes,ymax_goes = transform.transform(xmax,ymax)
print(f"{(xmax_goes - xmin_goes)=} m")
print(f"{(ymax_goes - ymin_goes)=} m")
bounds_goes = xmin_goes,ymin_goes,xmax_goes,ymax_goes
(xmax_goes - xmin_goes)=2304578.6198025653 m
(ymax_goes - ymin_goes)=2861053.251833326 m
68.11.3. Crop using clip_box#
Clip all three images to the same box
#
# now crop to these bounds using clip_box
#
clipped_cloud_temp=cloud_temp_da.rio.clip_box(*bounds_goes)
clipped_chan_14 = chan_14_da.rio.clip_box(*bounds_goes)
clipped_cloud_prob = cloud_prob_da.rio.clip_box(*bounds_goes)
clipped_cloud_temp.plot.imshow()
<matplotlib.image.AxesImage at 0x14e1942d0>
clipped_chan_14.plot.imshow()
<matplotlib.image.AxesImage at 0x17fb14190>
clipped_cloud_prob.plot.imshow()
<matplotlib.image.AxesImage at 0x17fbd02d0>
68.11.4. Again, note the cropped cloud_temp has a different shape and transform#
clipped_cloud_temp.shape,clipped_chan_14.shape,clipped_cloud_prob.shape
((1428, 1151), (1124, 1151), (1124, 1151))
clipped_cloud_temp.rio.transform(),clipped_chan_14.rio.transform(),clipped_cloud_prob.rio.transform()
(Affine(2004.0173614498456, 0.0, -811627.0084341107,
        0.0, -2004.017459908606, 5198420.860140239),
 Affine(2004.0173614498456, 0.0, -811627.0084341107,
        0.0, -2004.0174118249295, 4589199.76493266),
 Affine(2004.0173614498456, 0.0, -811627.0084341107,
        0.0, -2004.0174118249295, 4589199.76493266))
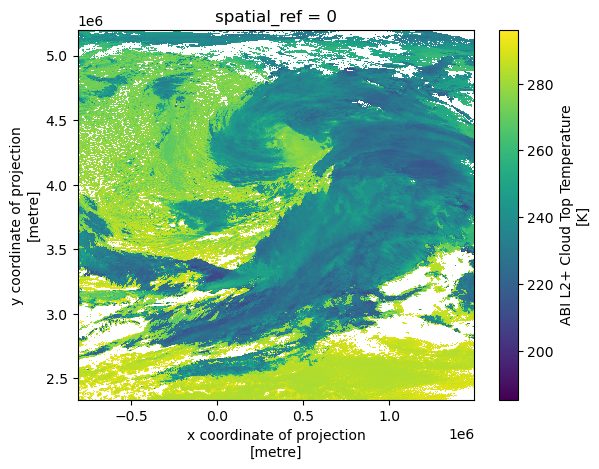
68.12. Use reproject_match to transform cloud_temp to same grid as clipped_chan14#
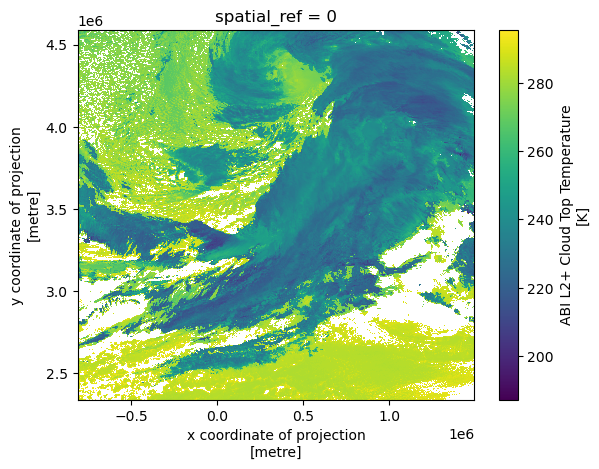
new_cloud_temp = clipped_cloud_temp.rio.reproject_match(clipped_chan_14)
new_cloud_temp.plot.imshow();
68.13. apply the cloud mask#
Mask all pixels that have less than a 99% chance of being cloudy
new_cloud_temp.data[clipped_cloud_prob < 0.99]=np.nan
clipped_chan_14.data[clipped_cloud_prob < 0.99] = np.nan
new_cloud_temp.plot.imshow();
clipped_chan_14.plot.imshow();
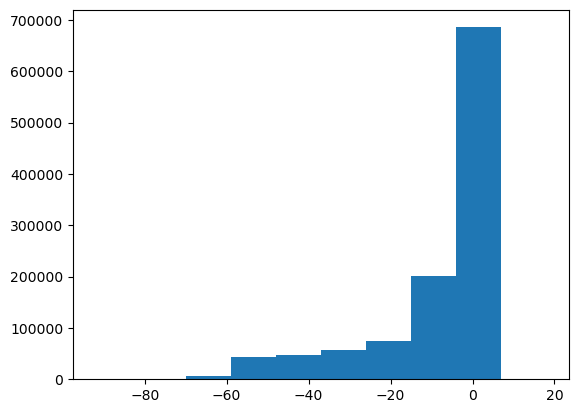
68.14. Find the cloud_temp - chan14 temperature difference#
68.14.1. Why are there large negative numbers?#
temp_diff = new_cloud_temp.data - clipped_chan_14.data
plt.hist(temp_diff.flat);
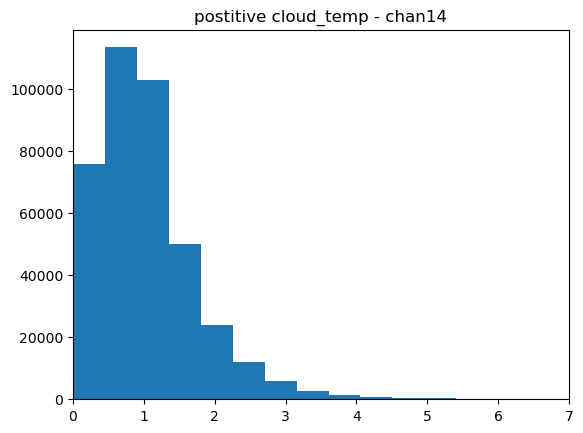
68.15. Repeat, but only for positive differences#
pos_temp_diff = temp_diff[temp_diff > 0.]
plt.hist(pos_temp_diff.flat,bins=40)
ax = plt.gca()
ax.set_xlim((0,7))
ax.set_title("postitive cloud_temp - chan14");